Page 571 - Fair, Geyer, and Okun's Water and wastewater engineering : water supply and wastewater removal
P. 571

JWCL344_ch14_500-554.qxd  8/7/10  8:56 PM  Page 528


                    528  Chapter 14  Design of Sewer Systems
                    14.11  STORM-PATTERN ANALYSIS

                                         Different from the averaging procedures associated in practice with the rational method of
                                         runoff analysis is the development of a generalized chronological storm pattern or hyeto-
                                         graph and its translation into a design runoff pattern by subtracting rates of (a) surface in-
                                         filtration, (b) depression storage, and (c) surface detention during overland flow. The
                                         runoff hydrograph obtained is routed through overland flow, gutter flow, and flow in build-
                                         ing drains, catch basins, and component sewers. Generalization of rainfall information by
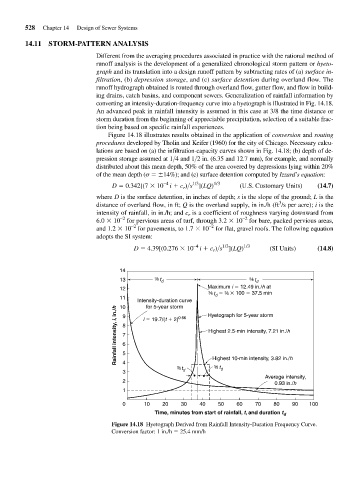
                                         converting an intensity-duration-frequency curve into a hyetograph is illustrated in Fig. 14.18.
                                         An advanced peak in rainfall intensity is assumed in this case at 3/8 the time distance or
                                         storm duration from the beginning of appreciable precipitation, selection of a suitable frac-
                                         tion being based on specific rainfall experiences.
                                             Figure 14.18 illustrates results obtained in the application of conversion and routing
                                         procedures developed by Tholin and Keifer (1960) for the city of Chicago. Necessary calcu-
                                         lations are based on (a) the infiltration-capacity curves shown in Fig. 14.18; (b) depth of de-
                                         pression storage assumed at 1>4 and 1>2 in. (6.35 and 12.7 mm), for example, and normally
                                         distributed about this mean depth, 50% of the area covered by depressions lying within 20%
                                         of the mean depth (  
14%); and (c) surface detention computed by Izzard’s equation:
                                                                       1/3
                                                              –4
                                              D   0.342[(7   10 i 	 c r )>s ](LQ) 1/3  (U.S. Customary Units)  (14.7)
                                          where D is the surface detention, in inches of depth; s is the slope of the ground; L is the
                                                                                                 3
                                          distance of overland flow, in ft; Q is the overland supply, in in./h (ft /s per acre); i is the
                                          intensity of rainfall, in in./h; and c r is a coefficient of roughness varying downward from
                                          6.0   10 –2  for pervious areas of turf, through 3.2   10 –2  for bare, packed pervious areas,
                                          and 1.2   10 –2  for pavements, to 1.7   10 –2  for flat, gravel roofs. The following equation
                                          adopts the SI system:
                                                                                1/3
                                                                       –4
                                                     D   4.39[(0.276   10 i 	 c r )>s ](LQ) 1/3  (SI Units)  (14.8)

                                                 14
                                                 13        3  8 t d                     5  8 t d
                                                 12                        Maximum i   12.49 in./h at
                                                                            3  t    3 8   100   37.5 min
                                                                            8  d
                                                 11
                                                      Intensity-duration curve  Hyetograph for 5-year storm
                                                         for 5-year storm
                                                 10
                                                Rainfall intensity, i, in./h  8  i   19.7/(t 	 2) 0.66  Highest 2.5-min intensity, 7.21 in./h
                                                 9
                                                 7
                                                 6
                                                 5
                                                 4
                                                                             5
                                                                               t
                                                                  3 8 t      Highest 10-min intensity, 3.82 in./h
                                                                              8
                                                                               d
                                                 3                  d
                                                                                             Average intensity,
                                                 2                                              0.93 in./h
                                                 1
                                                 0      10    20   30    40   50    60    70   80    90   100
                                                           Time, minutes from start of rainfall, t, and duration t d
                                              Figure 14.18 Hyetograph Derived from Rainfall Intensity-Duration Frequency Curve.
                                              Conversion factor: 1 in./h   25.4 mm/h
   566   567   568   569   570   571   572   573   574   575   576