
Page 72 - Fair, Geyer, and Okun's Water and wastewater engineering : water supply and wastewater removal
P. 72
JWCL344_ch02_029-060.qxd 8/2/10 9:14 PM Page 35
2.3 Storage as a Function of Draft and Runoff 35
2.3 STORAGE AS A FUNCTION OF DRAFT AND RUNOFF
A dam thrown across a river valley impounds the waters of the valley. Once the reservoir
has filled, the water drawn from storage is eventually replenished by the stream, provided
runoff, storage, and draft are kept in proper balance. The balance is struck graphically or
analytically on the basis of historical records or replications generated by suitable statisti-
cal procedures of operational hydrology.
Assuming that the reservoir is full at the beginning of a dry period, the maximum
2
2
amount of water S (MG/mi or ML/km ) that must be withdrawn from storage to maintain
2
2
a given average draft D (MG/mi or ML/km ) equals the maximum cumulative difference
2
2
between the draft D and the runoff Q (MG/mi or ML/km ) in a given dry period, or
S maximum value of (D Q) (2.1)
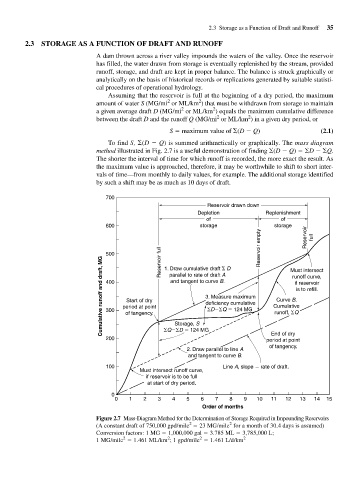
To find S, (D Q) is summed arithmetically or graphically. The mass diagram
method illustrated in Fig. 2.7 is a useful demonstration of finding (D Q) D Q.
The shorter the interval of time for which runoff is recorded, the more exact the result. As
the maximum value is approached, therefore, it may be worthwhile to shift to short inter-
vals of time—from monthly to daily values, for example. The additional storage identified
by such a shift may be as much as 10 days of draft.
700
Reservoir drawn down
Depletion Replenishment
of of
600 storage storage Reservoir full
500 Reservoir full 1. Draw cumulative draft D Reservoir empty Must intersect
Cumulative runoff and draft, MG 400 period at point parallel to rate of draft A Cumulative
runoff curve,
and tangent to curve B.
if reservoir
is to refill.
3. Measure maximum
Curve B.
Start of dry
deficiency cumulative
D Q 124 MG
300
runoff, Q
of tangency.
Storage, S
End of dry
200 Q D 124 MG period at point
of tangency.
2. Draw parallel to line A
and tangent to curve B.
100 Line A, slope rate of draft.
Must intersect runoff curve,
if reservoir is to be full
at start of dry period.
0
0 1 2 3 4 5 6 7 8 9 10 11 12 13 14 15
Order of months
Figure 2.7 Mass-Diagram Method for the Determination of Storage Required in Impounding Reservoirs
2
2
(A constant draft of 750,000 gpd/mile 23 MG/mile for a month of 30.4 days is assumed)
Conversion factors: 1 MG 1,000,000 gal 3.785 ML 3,785,000 L;
2
2
2
1 MG/mile 1.461 ML/km ; 1 gpd/mile 1.461 L/d/km 2