
Page 159 - Fiber Fracture
P. 159
144 P.K. Gupta
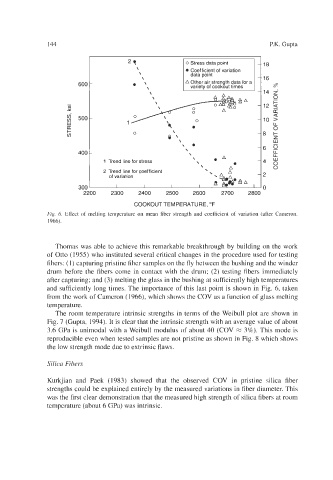
21 I 0 Stress data point 1418
\ Coefficient of variation
\ \ data point I I.^ ID
600 - *\ A Other air strength data for a
variety of cookout times
\ I114 0
._ 12 4
m
Y
n:
$ 500 -
W
LT
I-
0
400 -
1 Trend line for stress
2 Trend line for coefficient
of variation
-
300 n -
2300 2400 2500 2600 2700 2800
COOKOUT TEMPERATURE, OF
Fig. 6. Effect of melting temperature on mean fiber strength and coefficient of variation (after Cameron,
1966).
Thomas was able to achieve this remarkable breakthrough by building on the work
of Otto (1955) who instituted several critical changes in the procedure used for testing
fibers: (1) capturing pristine fiber samples on the fly between the bushing and the winder
drum before the fibers come in contact with the drum; (2) testing fibers immediately
after capturing; and (3) melting the glass in the bushing at sufficiently high temperatures
and sufficiently long times. The importance of this last point is shown in Fig. 6, taken
from the work of Cameron (1966), which shows the COV as a function of glass melting
temperature.
The room temperature intrinsic strengths in terms of the Weibull plot are shown in
Fig. 7 (Gupta, 1994). It is clear that the intrinsic strength with an average value of about
3.6 GPa is unimodal with a Weibull modulus of about 40 (COV = 3%). This mode is
reproducible even when tested samples are not pristine as shown in Fig. 8 which shows
the low strength mode due to extrinsic flaws.
Silica Fibers
Kurkjian and Paek (1983) showed that the observed COV in pristine silica fiber
strengths could be explained entirely by the measured variations in fiber diameter. This
was the first clear demonstration that the measured high strength of silica fibers at room
temperature (about 6 GPa) was intrinsic.