
Page 162 - Fiber Fracture
P. 162
STRENGTH OF GLASS FIBERS 147
I I I I I I I I I I I
20 "C -1 96 "C
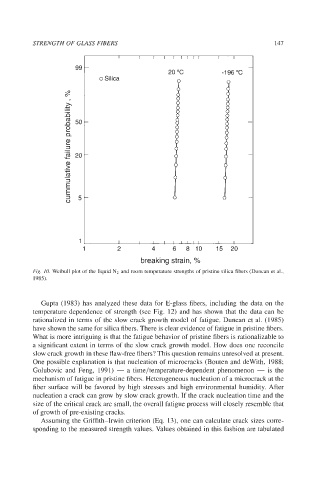
o Silica
I I I I I I I I I I I
1 2 4 6 8 10 15 20
breaking strain, %
Fig. IO. Weibull plot of the liquid N:! and room temperature strengths of pristine silica fibers (Duncan et al.,
1985).
Gupta (1983) has analyzed these data for E-glass fibers, including the data on the
temperature dependence of strength (see Fig. 12) and has shown that the data can be
rationalized in terms of the slow crack growth model of fatigue. Duncan et al. (1985)
have shown the same for silica fibers. There is clear evidence of fatigue in pristine fibers.
What is more intriguing is that the fatigue behavior of pristine fibers is rationalizable to
a significant extent in terms of the slow crack growth model. How does one reconcile
slow crack growth in these flaw-free fibers? This question remains unresolved at present.
One possible explanation is that nucleation of microcracks (Bouten and deWith, 1988;
Golubovic and Feng, 1991) - a time/temperature-dependent phenomenon - is the
mechanism of fatigue in pristine fibers. Heterogeneous nucleation of a microcrack at the
fiber surface will be favored by high stresses and high environmental humidity. After
nucleation a crack can grow by slow crack growth. If the crack nucleation time and the
size of the critical crack are small, the overall fatigue process will closely resemble that
of growth of pre-existing cracks.
Assuming the Griffith-Irwin criterion (Eq. 13), one can calculate crack sizes corre-
sponding to the measured strength values. Values obtained in this fashion are tabulated