
Page 161 - Fiber Fracture
P. 161
146 P.K. Gupta
HISTOGRAM WEIBULL PLOT
50 2.5 99
-
40 h 50
.
0
E!
2 30 4 20
10
4
+
n: 2 -2.5
20
8 v 1 .o
1
C
0.5
10
-7.5
D 4.0 5.5 7.0
STRENGTH, (Kpsi) Ln S, (Kpsi)
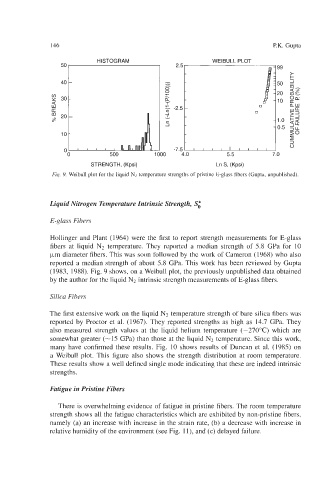
Fig. 9. Weibull plot for the liquid Nz temperature strengths of pristine E-glass fibers (Gupta, unpublished).
Liquid Nitrogen Temperature Intrinsic Strength, S;
E-glass Fibers
Hollinger and Plant (1964) were the first to report strength measurements for E-glass
fibers at liquid N2 temperature. They reported a median strength of 5.8 GPa for 10
km diameter fibers. This was soon followed by the work of Cameron (1968) who also
reported a median strength of about 5.8 GPa. This work has been reviewed by Gupta
(1983, 1988). Fig. 9 shows, on a Weibull plot, the previously unpublished data obtained
by the author for the liquid N2 intrinsic strength measurements of E-glass fibers.
Silica Fibers
The first extensive work on the liquid N2 temperature strength of bare silica fibers was
reported by Proctor et al. (1967). They reported strengths as high as 14.7 GPa. They
also measured strength values at the liquid helium temperature (-270°C) which are
somewhat greater (-15 GPa) than those at the liquid N2 temperature. Since this work,
many have confirmed these results. Fig. 10 shows results of Duncan et al. (1985) on
a Weibull plot. This figure also shows the strength distribution at room temperature.
These results show a well defined single mode indicating that these are indeed intrinsic
strengths.
Fatigue in Pristine Fibers
There is overwhelming evidence of fatigue in pristine fibers. The room temperature
strength shows all the fatigue characteristics which are exhibited by non-pristine fibers,
namely (a) an increase with increase in the strain rate, (b) a decrease with increase in
relative humidity of the environment (see Fig. 1 l), and (c) delayed failure.