
Page 26 - Fiber Fracture
P. 26
FIBER FRACTURE: AN OVERVIEW 11
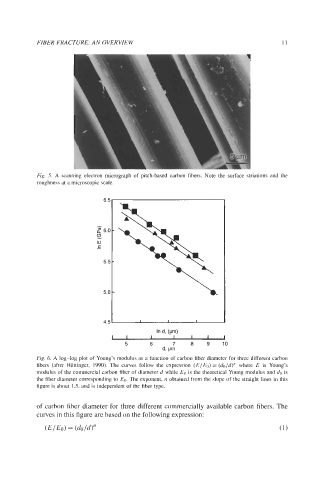
Fig. 5. A scanning electron micrograph of pitch-based carbon fibers. Note the surface striations and the
roughness at a microscopic scale.
6.5
2 6.0
(3
W
C -
5.5
5.0
4.5 1 1 * L
In d, (pm)
I 1 1 k I L 1
5 6 7 8 9 1 0
d, vn
Fig. 6. A log-log plot of Young’s modulus as a function of carbon fiber diameter for three different carbon
fibers (after Huttinger, 1990). The curves follow the expression (E/&) = (do/d)” where E is Young’s
modulus of the commercial carbon fiber of diameter d while Eo is the theoretical Young modulus and do is
the fiber diameter corresponding to EO. The exponent, n obtained from the slope of the straight lines in this
figure is about 1.5, and is independent of the fiber type.
of carbon fiber diameter for three different commercially available carbon fibers. The
curves in this figure are based on the following expression:
(EIEo) = (dO/d>” (1)