
Page 33 - Fiber Fracture
P. 33
18 K.K. Chawla
withstand static fatigue. Slow strength degradation can occur due to static fatigue and
eventually causing the optical glass fiber to fracture. With increasing usage of optical
glass fiber (some applications are very demanding, e.g. fiber optic cables buried in the
top layer of the ocean floor), the issue of reliability has become very important.
Many brittle, amorphous materials such as thermosetting polymers and silica-based
inorganic glasses show some telltale markings on their fracture surfaces (Mecholsky et
al., 1977, 1979; Chandan et al., 1994). Typically, the fracture surface of a glass fiber
shows four distinct regions. These regions are: a smooth mirror region, a misty region
of small radial ridges, a hackle region consisting of large ridges, and finally a region of
extensive crack branching. It turns out that the product of strength, 0, and the square
root of the distance of each of these regions from the origin of fracture, is a constant.
One can write:
0RY.’ = Ai
where Ai is a constant, Ri the radius of the mirror-mist, mist-hackle, or crack branching
boundaries. These radii can be related to the initial flaw-depth, a, or the half-width, b,
through the fracture mechanics analysis:
c/Ri = K1,Y2/2A?
where c = (ab)’.’, Y is a geometrical constant and KI, is the critical stress intensity
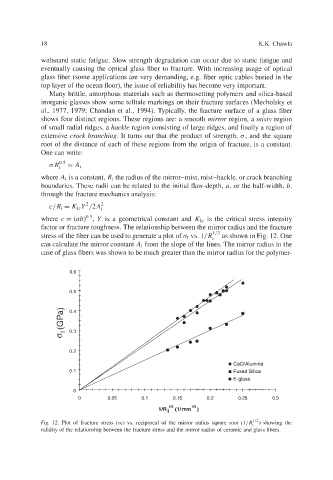
factor or fracture toughness. The relationship between the mirror radius and the fracture
stress of the fiber can be used to generate a plot of vs. 1/R:’2 as shown in Fig. 12. One
can calculate the mirror constant Ai from the slope of the lines. The mirror radius in the
case of glass fibers was shown to be much greater than the mirror radius for the polymer-
T
0.6
0.5
n 0.4
a
a
c3
0.3
0.2
0 CaO/Alumina
0.1 4 Fused Silica
0 E-glass
0 I
0 0.05 0.1 0.15 0.2 0.25 0.3
I/R? (l/rnm’”)
Fig. 12. Plot of fracture stress (of) vs. reciprocal of the mirror radius square root (l/f?;’*) showing the
validity of the relationship between the fracture stress and the mirror radius of ceramic and glass fibers.