
Page 352 - Fiber Fracture
P. 352
334 J.W.S. Hearle
B
I
A
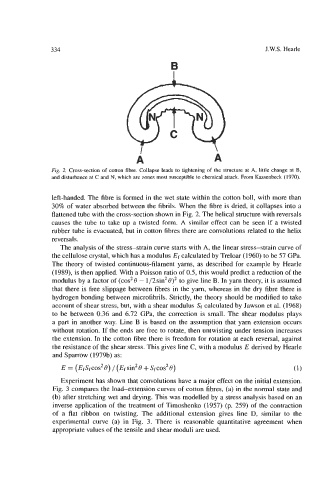
Fig. 2. Cross-section of cotton fibre. Collapse leads to tightening of the structure at A, little change at B,
and disturbance at C and N, which are zones most susceptible to chemical attack. From Kassenbeck (1970).
left-handed. The fibre is formed in the wet state within the cotton boll, with more than
30% of water absorbed between the fibrils. When the fibre is dried, it collapses into a
flattened tube with the cross-section shown in Fig. 2. The helical structure with reversals
causes the tube to take up a twisted form. A similar effect can be seen if a twisted
rubber tube is evacuated, but in cotton fibres there are convolutions related to the helix
reversals.
The analysis of the stress-strain curve starts with A, the linear stress-strain curve of
the cellulose crystal, which has a modulus Ef calculated by Treloar (1960) to be 57 GPa.
The theory of twisted continuous-filament yarns, as described for example by Hearle
(1989), is then applied. With a Poisson ratio of 0.5, this would predict a reduction of the
modulus by a factor of (cos2 8 - 1/2 sin' 0)' to give line B. In yam theory, it is assumed
that there is free slippage between fibres in the yarn, whereas in the dry fibre there is
hydrogen bonding between microfibrils. Strictly, the theory should be modified to take
account of shear stress, but, with a shear modulus Sf calculated by Jawson et al. (1968)
to be between 0.36 and 6.72 GPa, the correction is small. The shear modulus plays
a part in another way. Line B is based on the assumption that yarn extension occurs
without rotation. If the ends are free to rotate, then untwisting under tension increases
the extension. In the cotton fibre there is freedom for rotation at each reversal, against
the resistance of the shear stress. This gives line C, with a modulus E derived by Hearle
and Sparrow (1979b) as:
E = ( EfSfcos2 0) / (Ef sin2 8 + Sf cos' 0) (1)
Experiment has shown that convolutions have a major effect on the initial extension.
Fig. 3 compares the load-extension curves of cotton fibres, (a) in the normal state and
(b) after stretching wet and drying. This was modelled by a stress analysis based on an
inverse application of the treatment of Timoshenko (1957) (p. 259) of the contraction
of a flat ribbon on twisting. The additional extension gives line D, similar to the
experimental curve (a) in Fig. 3. There is reasonable quantitative agreement when
appropriate values of the tensile and shear moduli are used.