
Page 357 - Fiber Fracture
P. 357
FRACTURE OF COMMON TEXTILE FIBRES 339
Strain
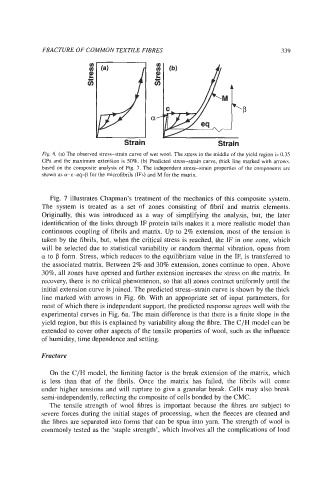
Fig. 6. (a) The observed stress-strain curve of wet wool. The stress in the middle of the yield region is 0.35
GPa and the maximum extension is 50%. (b) Predicted stress-strain curve, thick line marked with arrows,
based on the composite analysis of Fig. 7. The independent stress-strain properties of the components are
shown as a-c-eq-b for the microfibrils (IFs) and M for the matrix.
Fig. 7 illustrates Chapman’s treatment of the mechanics of this composite system.
The system is treated as a set of zones consisting of fibril and matrix elements.
Originally, this was introduced as a way of simplifying the analysis, but, the later
identification of the links through IF protein tails makes it a more realistic model than
continuous coupling of fibrils and matrix. Up to 2% extension, most of the tension is
taken by the fibrils, but, when the critical stress is reached, the IF in one zone, which
will be selected due to statistical variability or random thermal vibration, opens from
a to 6 form. Stress, which reduces to the equilibrium value in the IF, is transferred to
the associated matrix. Between 2% and 30% extension, zones continue to open. Above
30%, all zones have opened and further extension increases the stress on the matrix. In
recovery, there is no critical phenomenon, so that all zones contract uniformly until the
initial extension curve is joined. The predicted stress-strain curve is shown by the thick
line marked with arrows in Fig. 6b. With an appropriate set of input parameters, for
most of which there is independent support, the predicted response agrees well with the
experimental curves in Fig. 6a. The main difference is that there is a finite slope in the
yield region, but this is explained by variability along the fibre. The C/H model can be
extended to cover other aspects of the tensile properties of wool, such as the influence
of humidity, time dependence and setting.
Fracture
On the C/H model, the limiting factor is the break extension of the matrix, which
is less than that of the fibrils. Once the matrix has failed, the fibrils will come
under higher tensions and will rupture to give a granular break. Cells may also break
semi-independently, reflecting the composite of cells bonded by the CMC.
The tensile strength of wool fibres is important because the fibres are subject to
severe forces during the initial stages of processing, when the fleeces are cleaned and
the fibres are separated into forms that can be spun into yarn. The strength of wool is
commonly tested as the ‘staple strength’, which involves all the complications of load