
Page 359 - Fiber Fracture
P. 359
FRACTURE OF COMMON TEXTILE FIBRES 34 1
35
30
25
- 20
0
U
5 15
10
5
0
0 200 400 600 800 1000 1200 1400 1600
CSA (urn2)
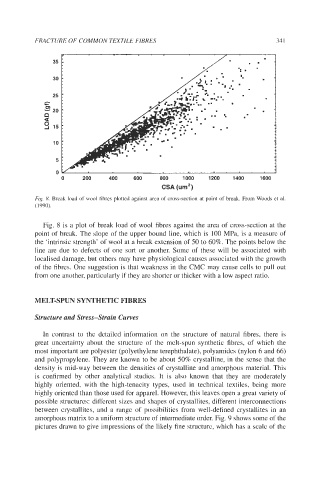
Fig. 8. Break load of wool fibres plotted against area of cross-section at point of break. From Woods et al.
(1990).
Fig. 8 is a plot of break load of wool fibres against the area of cross-section at the
point of break. The slope of the upper bound line, which is 100 MPa, is a measure of
the ‘intrinsic strength’ of wool at a break extension of 50 to 60%. The points below the
line are due to defects of one sort or another. Some of these will be associated with
localised damage, but others may have physiological causes associated with the growth
of the fibres. One suggestion is that weakness in the CMC may cause cells to pull out
from one another, particularly if they are shorter or thicker with a low aspect ratio.
MELT-SPUN SYNTHETIC FIBRES
Structure and Stress-Strain Curves
In contrast to the detailed information on the structure of natural fibres, there is
great uncertainty about the structure of the melt-spun synthetic fibres, of which the
most important are polyester (polyethylene terephthalate), polyamides (nylon 6 and 66)
and polypropylene. They are known to be about 50% crystalline, in the sense that the
density is mid-way between the densities of crystalline and amorphous material. This
is confirmed by other analytical studies. It is also known that they are moderately
highly oriented, with the high-tenacity types, used in technical textiles, being more
highly oriented than those used for apparel. However, this leaves open a great variety of
possible structures: different sizes and shapes of crystallites, different interconnections
between crystallites, and a range of possibilities from well-defined crystallites in an
amorphous matrix to a uniform structure of intermediate order. Fig. 9 shows some of the
pictures drawn to give impressions of the likely fine structure, which has a scale of the