
Page 186 - Finance for Non-Financial Managers
P. 186
Siciliano10.qxd 2/10/2003 3:07 PM Page 167
The Annual Budget: Financing Your Plans
167
500 units a month, but with inefficiency, unexpected problems,
or perhaps even good luck, volume could be anywhere from
300 units to 600 units, a big variation for which to plan. Such
fluctuations could significantly impair budget analysis. Looking
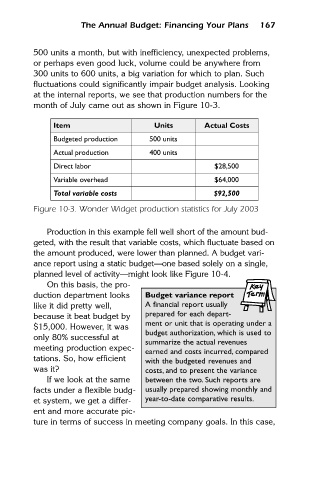
at the internal reports, we see that production numbers for the
month of July came out as shown in Figure 10-3.
Item Units Actual Costs
Budgeted production 500 units
Actual production 400 units
Direct labor $28,500
Variable overhead $64,000
Total variable costs $92,500
Figure 10-3. Wonder Widget production statistics for July 2003
Production in this example fell well short of the amount bud-
geted, with the result that variable costs, which fluctuate based on
the amount produced, were lower than planned. A budget vari-
ance report using a static budget—one based solely on a single,
planned level of activity—might look like Figure 10-4.
On this basis, the pro-
duction department looks Budget variance report
like it did pretty well, A financial report usually
because it beat budget by prepared for each depart-
$15,000. However, it was ment or unit that is operating under a
budget authorization, which is used to
only 80% successful at
summarize the actual revenues
meeting production expec-
earned and costs incurred, compared
tations. So, how efficient with the budgeted revenues and
was it? costs, and to present the variance
If we look at the same between the two. Such reports are
facts under a flexible budg- usually prepared showing monthly and
et system, we get a differ- year-to-date comparative results.
ent and more accurate pic-
ture in terms of success in meeting company goals. In this case,