
Page 187 - Finance for Non-Financial Managers
P. 187
Siciliano10.qxd 2/10/2003 3:07 PM Page 168
168
Variance:
Budget cost per
Actual cost per
Static
Favorable
Actual
unit produced
unit produced
Production in units Finance for Non-Financial Managers Budget (Unfavorable)
(100)
500
400
Direct labor $71.25 $65.00 $28,500 $32,500 $4,000
Variable overhead $160.00 $150.00 64,000 75,000 11,000
Total variable costs $92,500 $107,500 $15,000
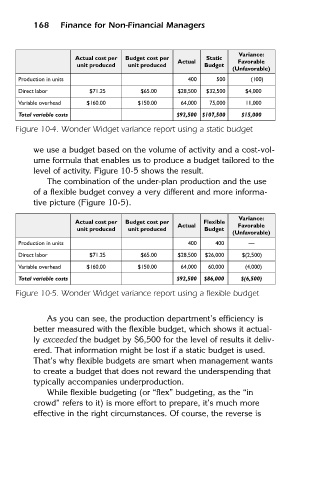
Figure 10-4. Wonder Widget variance report using a static budget
we use a budget based on the volume of activity and a cost-vol-
ume formula that enables us to produce a budget tailored to the
level of activity. Figure 10-5 shows the result.
The combination of the under-plan production and the use
of a flexible budget convey a very different and more informa-
tive picture (Figure 10-5).
Variance:
Actual cost per Budget cost per Flexible
Actual Favorable
unit produced unit produced Budget
(Unfavorable)
Production in units 400 400 —
Direct labor $71.25 $65.00 $28,500 $26,000 $(2,500)
Variable overhead $160.00 $150.00 64,000 60,000 (4,000)
Total variable costs $92,500 $86,000 $(6,500)
Figure 10-5. Wonder Widget variance report using a flexible budget
As you can see, the production department’s efficiency is
better measured with the flexible budget, which shows it actual-
ly exceeded the budget by $6,500 for the level of results it deliv-
ered. That information might be lost if a static budget is used.
That’s why flexible budgets are smart when management wants
to create a budget that does not reward the underspending that
typically accompanies underproduction.
While flexible budgeting (or “flex” budgeting, as the “in
crowd” refers to it) is more effort to prepare, it’s much more
effective in the right circumstances. Of course, the reverse is