
Page 189 - Finance for Non-Financial Managers
P. 189
Siciliano10.qxd 2/10/2003 3:07 PM Page 170
Finance for Non-Financial Managers
170
The Wonder Widget Company
Budget Variance Report, Sales, July 2003
Current Month Year to Date
Actual Budget Variance Actual Budget Variance
Salaries $42,050 $40,920 $(1,130) $294,500 $287,000 $(7,500)
Payroll taxes 4,420 4,092 (328) 29,920 28,700 (1,220)
Workers’ comp 575 409 (166) 3,010 2,870 (140)
Group insurance 1,550 1,200 (350) 15,200 8,500 (6,700)
Advertising 3,250 1,976 (1,274) 42,005 45,000 2,995
Automobile 800 650 (150) 5,520 4,800 (720)
Business promotion 950 1,050 100 7,260 7,500 240
Commissions 1,520 1,478 (42) 11,650 10,500 (1,150)
Meals and entertainment 475 560 85 4,250 3,600 (650)
Insurance 675 642 (33) 2,650 4,300 1,650
Office supplies 250 200 (50) 1,675 1,400 (275)
Outside services 810 1,000 190 8,210 7,200 (1,010)
Postage 275 300 25 2,246 2,500 254
Rent 11,500 11,500 — 80,500 80,500 —
Telephone 400 450 50 3,350 3,200 (150)
Trade shows 5,450 5,000 (450) 18,450 25,000 6,550
Travel and lodging 3,695 3,500 (195) 17,320 18,000 680
Total Sales/Marketing $78,645 $74,927 $(3,718) $547,716 $540,570 $(7,146)
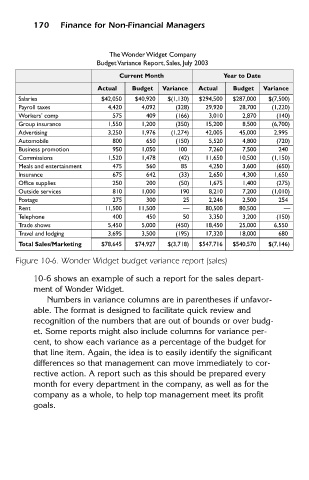
Figure 10-6. Wonder Widget budget variance report (sales)
10-6 shows an example of such a report for the sales depart-
ment of Wonder Widget.
Numbers in variance columns are in parentheses if unfavor-
able. The format is designed to facilitate quick review and
recognition of the numbers that are out of bounds or over budg-
et. Some reports might also include columns for variance per-
cent, to show each variance as a percentage of the budget for
that line item. Again, the idea is to easily identify the significant
differences so that management can move immediately to cor-
rective action. A report such as this should be prepared every
month for every department in the company, as well as for the
company as a whole, to help top management meet its profit
goals.