
Page 230 - Finite Element Analysis with ANSYS Workbench
P. 230
11.3 Academic Example 221
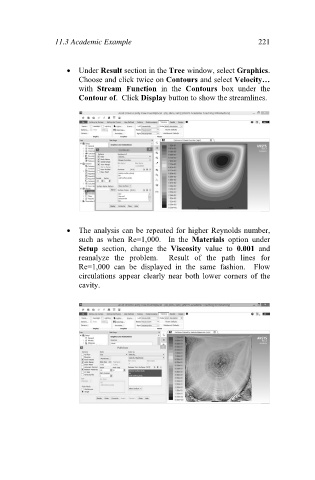
Under Result section in the Tree window, select Graphics.
Choose and click twice on Contours and select Velocity…
with Stream Function in the Contours box under the
Contour of. Click Display button to show the streamlines.
The analysis can be repeated for higher Reynolds number,
such as when Re=1,000. In the Materials option under
Setup section, change the Viscosity value to 0.001 and
reanalyze the problem. Result of the path lines for
Re=1,000 can be displayed in the same fashion. Flow
circulations appear clearly near both lower corners of the
cavity.