Page 258 - Finite Element Analysis with ANSYS Workbench
P. 258

3
                                 12.3 Academic Example                                     249


                                                        d
                                              e
                                                                                       c
                                                                             o
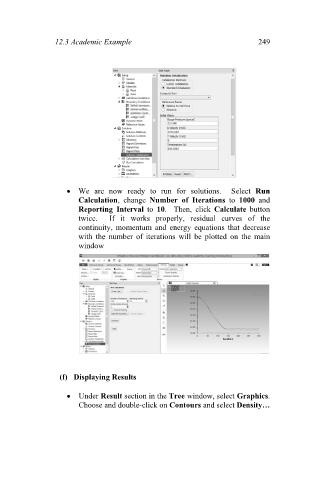
                                       We  are now ready  to  run  for  solutions.    Select  Run
                                              a
                                        Calculation,  change  Number  of  Iterations to  1000 and
                                                         g
                                                                                      0
                                                                             t
                                              i
                                                        a
                                                                                      e
                                                                            k
                                                                   T
                                        Reporting  Interval to  10.    Then,  click  Calculate  button
                                                        o
                                        twice.    If  it  works  properrly,  residual  curves  of  the
                                                                            u
                                                                             t
                                                                   n
                                        continuity, momentum  and energy equations that decrease
                                              i
                                                        n
                                                                                      d
                                                                             l
                                              e
                                        with  the  number  of  iterations  will  be  plotted  on  the  main
                                                        o
                                                                                       h
                                                                  s
                                        window
                                             w


                                              n
                                  (f)  Displaying Results

                                                                                      r
                                       Under Result section in the Tree window, select Graphics.
                                                                            w
                                              R
                                                                                      e
                                                        e
                                        Choose and double-click on Contours and select Density…
                                                                            n
                                                                 C
   253   254   255   256   257   258   259   260   261   262   263