
Page 304 - Finite Element Modeling and Simulations with ANSYS Workbench
P. 304
Structural Vibration and Dynamics 289
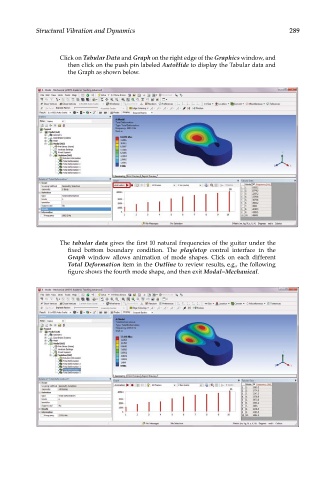
Click on Tabular Data and Graph on the right edge of the Graphics window, and
then click on the push pin labeled AutoHide to display the Tabular data and
the Graph as shown below.
The tabular data gives the first 10 natural frequencies of the guitar under the
fixed bottom boundary condition. The play/stop control interface in the
Graph window allows animation of mode shapes. Click on each different
Total Deformation item in the Outline to review results, e.g., the following
figure shows the fourth mode shape, and then exit Modal–Mechanical.