
Page 381 - Finite Element Modeling and Simulations with ANSYS Workbench
P. 381
366 Finite Element Modeling and Simulation with ANSYS Workbench
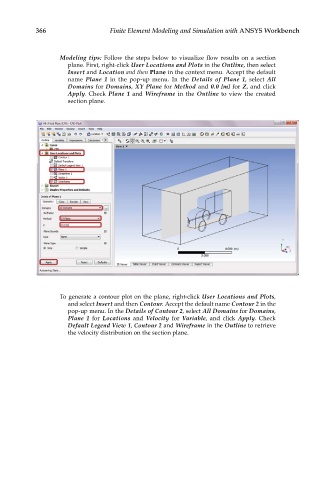
Modeling tips: Follow the steps below to visualize flow results on a section
plane. First, right-click User Locations and Plots in the Outline, then select
Insert and Location and then Plane in the context menu. Accept the default
name Plane 1 in the pop-up menu. In the Details of Plane 1, select All
Domains for Domains, XY Plane for Method and 0.0 [m] for Z, and click
Apply. Check Plane 1 and Wireframe in the Outline to view the created
section plane.
To generate a contour plot on the plane, right-click User Locations and Plots,
and select Insert and then Contour. Accept the default name Contour 2 in the
pop-up menu. In the Details of Contour 2, select All Domains for Domains,
Plane 1 for Locations and Velocity for Variable, and click Apply. Check
Default Legend View 1, Contour 2 and Wireframe in the Outline to retrieve
the velocity distribution on the section plane.