
Page 351 - Flexible Robotics in Medicine
P. 351
342 Chapter 14
Calibration result (y-axis)
0.025
0.02 FBG1
Wavelength shift (nm) 0.015 FBG2
0.01
Linear
(FBG1)
0.005
(FBG2)
0 Linear
0 0.2 0.4 0.6 0.8 1
–0.005
Force (N)
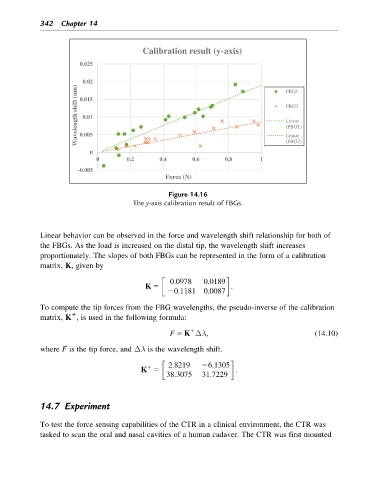
Figure 14.16
The y-axis calibration result of FBGs.
Linear behavior can be observed in the force and wavelength shift relationship for both of
the FBGs. As the load is increased on the distal tip, the wavelength shift increases
proportionately. The slopes of both FBGs can be represented in the form of a calibration
matrix, K, given by
0:0978 0:0189
K 5 :
20:1181 0:0087
To compute the tip forces from the FBG wavelengths, the pseudo-inverse of the calibration
1
matrix, K , is used in the following formula:
1
F 5 K Δλ; (14.10)
where F is the tip force, and Δλ is the wavelength shift.
1
K 5 2:8219 26:1305 :
38:3075 31:7229
14.7 Experiment
To test the force sensing capabilities of the CTR in a clinical environment, the CTR was
tasked to scan the oral and nasal cavities of a human cadaver. The CTR was first mounted