
Page 375 - Fluid-Structure Interactions Slender Structure and Axial Flow (Volume 1)
P. 375
11 Avg 50% Ov Ip 10 Ave 50% Ov 1~
0.5 r I I 0.5
4.3' ' I I 1 I -0.3 ! I I I I I I 1 I 1 I
0 Time (s) 16 0 Time (s) 16
-
-
-
5 0.0
.3
-
4.9 ' ' " ' ' ' ' I I I .. I ... I.... 1 .I
-2.8 0.0 2.1
w (V)
pG-T2T
w
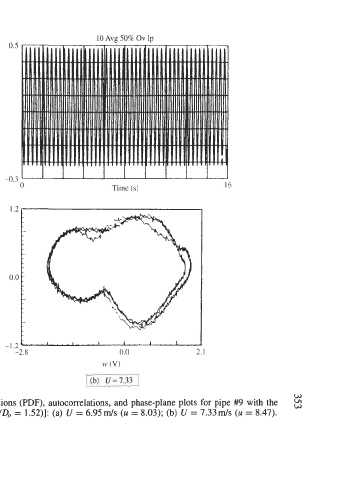
Figure 5.31 Experimental vibration spectra (PS), probability density functions (PDF), autocorrelations, and phase-plane plots for pipe #9 with the
polycarbonate constraining bars [Figure 5.30; (b = 0.65, wb/L = 0.055 (Wb/Do = 1.52)]: (a) u = 6.95 m/s (u = 8.03); (b) u = 7.33 m/S (u = 8.47).