
Page 181 - Formation Damage during Improved Oil Recovery Fundamentals and Applications
P. 181
156 Thomas Russell et al.
6
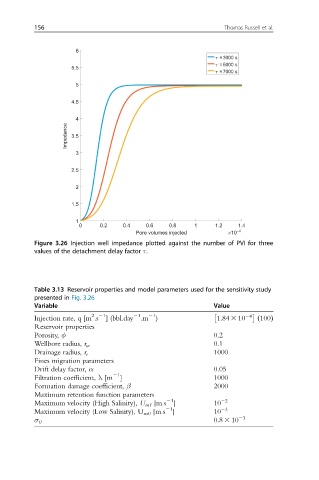
t =3000 s
t =5000 s
5.5
t =7000 s
5
4.5
4
Impedance 3.5
3
2.5
2
1.5
1
0 0.2 0.4 0.6 0.8 1 1.2 1.4
Pore volumes injected ×10 –4
Figure 3.26 Injection well impedance plotted against the number of PVI for three
values of the detachment delay factor τ.
Table 3.13 Reservoir properties and model parameters used for the sensitivity study
presented in Fig. 3.26
Variable Value
21
21
2 21
Injection rate, q [m .s ] (bbl.day .m ) 1:84 3 10 24 ð 100Þ
Reservoir properties
Porosity, φ 0:2
0:1
Wellbore radius, r w
1000
Drainage radius, r e
Fines migration parameters
Drift delay factor, α 0:05
21
Filtration coefficient, λ [m ] 1000
Formation damage coefficient, β 2000
Maximum retention function parameters
21
Maximum velocity (High Salinity), U m1 [m.s ] 10 22
21
Maximum velocity (Low Salinity), U m0 [m.s ] 10 23
0:8 3 10 23
σ 0