
Page 254 - Formation Damage during Improved Oil Recovery Fundamentals and Applications
P. 254
Formation Damage by Inorganic Deposition 225
Table 5.2 Coefficients of equation to calculate K value at equilibrium for calcite,
aragonite, and vaterite
Species A B C D
Calcite 2 171.9065 2 0.07799 2839.319 71.595
Aragonite 2 171.9773 2 0.07799 2903.293 71.595
Vaterite 2 172.1295 2 0.07799 3074.688 71.595
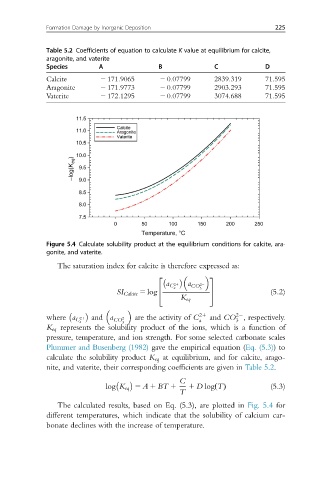
Figure 5.4 Calculate solubility product at the equilibrium conditions for calcite, ara-
gonite, and vaterite.
The saturation index for calcite is therefore expressed as:
2 3
a C 21 a CO 22
a 3
SI Calcite 5 log 4 5 (5.2)
K eq
21 22
21 and a 22 are the activity of C and CO , respectively.
where a C CO a 3
a 3
K eq represents the solubility product of the ions, which is a function of
pressure, temperature, and ion strength. For some selected carbonate scales
Plummer and Busenberg (1982) gave the empirical equation (Eq. (5.3))to
calculate the solubility product K eq at equilibrium, and for calcite, arago-
nite, and vaterite, their corresponding coefficients are given in Table 5.2.
C
log K eq 5 A 1 BT 1 1 D log TðÞ (5.3)
T
The calculated results, based on Eq. (5.3), are plotted in Fig. 5.4 for
different temperatures, which indicate that the solubility of calcium car-
bonate declines with the increase of temperature.