
Page 255 - Formation Damage during Improved Oil Recovery Fundamentals and Applications
P. 255
226 Xingru Wu
Table 5.3 Coefficients for strontium sulfate, gypsum, anhydrite, and barium sulfate
Species A B C 3 10 26 I h I g
Strontium Sulfate 641.541 2 1.90146 2 42.7605 2,51,748 4102.24
Gypsum 763.714 2 2.04731 2 43.2002 2,82,176 4837.58
Anhydrite 689.581 2 1.94455 2 45.0378 2,87,889 4432.9
Barium Sulfate 594.534 2 1.91171 2 40.0731 2,00,488 3840.12
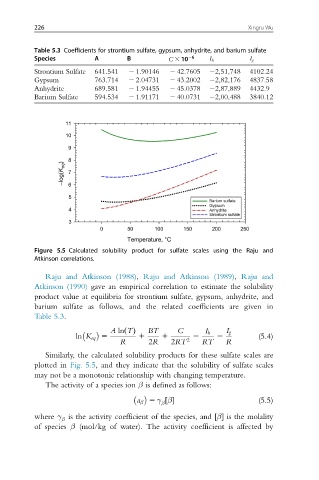
Figure 5.5 Calculated solubility product for sulfate scales using the Raju and
Atkinson correlations.
Raju and Atkinson (1988), Raju and Atkinson (1989), Raju and
Atkinson (1990) gave an empirical correlation to estimate the solubility
product value at equilibria for strontium sulfate, gypsum, anhydrite, and
barium sulfate as follows, and the related coefficients are given in
Table 5.3.
A ln TðÞ BT C
I h I g
ln K eq 5 1 1 2 2 (5.4)
R 2R 2RT 2 RT R
Similarly, the calculated solubility products for these sulfate scales are
plotted in Fig. 5.5, and they indicate that the solubility of sulfate scales
may not be a monotonic relationship with changing temperature.
The activity of a species ion β is defined as follows:
a β 5 γ β ½ (5.5)
β
where γ is the activity coefficient of the species, and β ½ is the molality
β
of species β (mol/kg of water). The activity coefficient is affected by