Page 59 - Formation Damage during Improved Oil Recovery Fundamentals and Applications
P. 59

(A)  1
                                   a) Low-salinity waterflooding considering fines
                         0.9     BL shock
                         0.8
                        Dimensionless distance, x D  0.7

                         0.6
                         0.5
                         0.4
                         0.3
                         0.2
                         0.1
                          0
                           0       0.2     0.4     0.6      0.8     1
                                         Injected pore volume, t D
                              S  = 0.80  S wi  = 0.79  S  = 0.75  S  = 0.70  S  = 0.69
                               wi               wi      wi      wi
                              S  = 0.67  S  = 0.65  S  = 0.62  S  = 0.60
                               wi      wi      wi       wi
                       (B)  1
                                   b) Low-salinity waterflooding considering fines
                         0.9
                         0.8
                        Water saturation, S w  0.6
                         0.7
                         0.5
                         0.4
                         0.3
                         0.2               “Flood-front” saturation
                         0.1
                          0
                           0       0.2     0.4     0.6      0.8     1
                                         Injected pore volume, t D
                              S  = 0.80  S wi  = 0.79  S  = 0.75  S  = 0.70  S  = 0.69
                               wi               wi      wi       wi
                              S  = 0.67  S  = 0.65  S  = 0.62  S  = 0.60
                               wi      wi       wi      wi
                       (C)  1
                                    c) Conventional waterflooding without fines
                         0.9  BL shock  migration (Buckley-Leverett Problem)
                        Dimensionless distance, x D  0.6
                         0.8
                         0.7
                         0.5
                         0.4
                         0.3
                         0.2
                         0.1
                          0
                           0       0.2     0.4     0.6      0.8     1
                                         Injected pore volume, t D
                              S  = 0.80  S  = 0.75  S  = 0.70  S  = 0.65  S wi  = 0.60
                               wi      wi       wi      wi
                              S  = 0.55  S  = 0.50  S  = 0.45  S  = 0.39
                               wi      wi       wi      wi
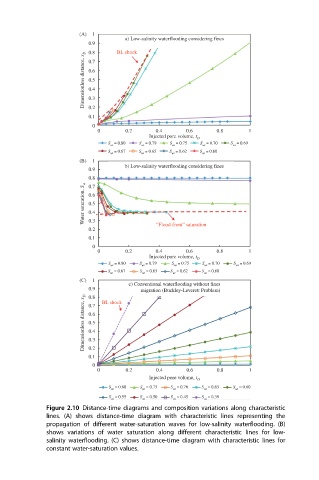
              Figure 2.10 Distance-time diagrams and composition variations along characteristic
              lines. (A) shows distance-time diagram with characteristic lines representing the
              propagation of different water-saturation waves for low-salinity waterflooding. (B)
              shows variations of water saturation along different characteristic lines for low-
              salinity waterflooding. (C) shows distance-time diagram with characteristic lines for
              constant water-saturation values.
   54   55   56   57   58   59   60   61   62   63   64