
Page 304 - T. Anderson-Fracture Mechanics - Fundamentals and Applns.-CRC (2005)
P. 304
1656_C006.fm Page 284 Monday, May 23, 2005 5:50 PM
284 Fracture Mechanics: Fundamentals and Applications
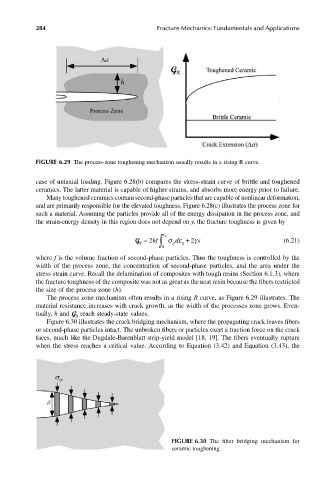
FIGURE 6.29 The process-zone toughening mechanism usually results in a rising R curve.
case of uniaxial loading. Figure 6.28(b) compares the stress-strain curve of brittle and toughened
ceramics. The latter material is capable of higher strains, and absorbs more energy prior to failure.
Many toughened ceramics contain second-phase particles that are capable of nonlinear deformation,
and are primarily responsible for the elevated toughness. Figure 6.28(c) illustrates the process zone for
such a material. Assuming the particles provide all of the energy dissipation in the process zone, and
the strain-energy density in this region does not depend on y, the fracture toughness is given by
d
G = R hf ∫ ij ε σε i j + 2 2γ s (6.21)
i
j
0
where f is the volume fraction of second-phase particles. Thus the toughness is controlled by the
width of the process zone, the concentration of second-phase particles, and the area under the
stress-strain curve. Recall the delamination of composites with tough resins (Section 6.1.3), where
the fracture toughness of the composite was not as great as the neat resin because the fibers restricted
the size of the process zone (h).
The process zone mechanism often results in a rising R curve, as Figure 6.29 illustrates. The
material resistance increases with crack growth, as the width of the processes zone grows. Even-
tually, h and G reach steady-state values.
R
Figure 6.30 illustrates the crack bridging mechanism, where the propagating crack leaves fibers
or second-phase particles intact. The unbroken fibers or particles exert a traction force on the crack
faces, much like the Dugdale-Barenblatt strip-yield model [18, 19]. The fibers eventually rupture
when the stress reaches a critical value. According to Equation (3.42) and Equation (3.43), the
FIGURE 6.30 The fiber bridging mechanism for
ceramic toughening.