
Page 254 - From Smart Grid to Internet of Energy
P. 254
226 From smart grid to internet of energy
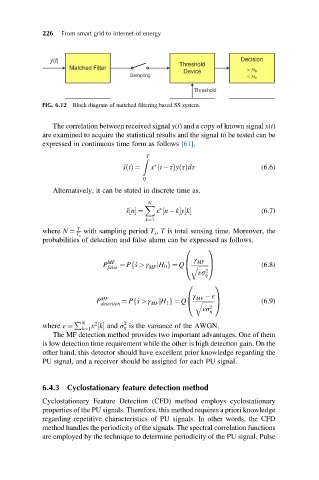
FIG. 6.12 Block diagram of matched filtering based SS system.
The correlation between received signal y(t) and a copy of known signal x(t)
are examined to acquire the statistical results and the signal to be tested can be
expressed in continuous time form as follows [61].
Z T
∗
ð
^ stðÞ ¼ x t τÞy τðÞdτ (6.6)
0
Alternatively, it can be stated in discrete time as.
N
∗
X
^ sn½ ¼ x n kyk½ (6.7)
½
k¼1
T
where N ¼ with sampling period T s , T is total sensing time. Moreover, the
T s
probabilities of detection and false alarm can be expressed as follows.
0 1
γ
P MF ¼ P ^ s > γ j B MF C (6.8)
f
false MF H 0 g ¼ Q q ffiffiffiffiffiffiffiA
@
εσ 2 η
0 1
γ
P MF ¼ P ^ s > γ j B MF εC (6.9)
f
detection MF H 1 g ¼ Q@ q ffiffiffiffiffiffiffi A
εσ 2 η
P N 2 2
where ε ¼ x k½ and σ η is the variance of the AWGN.
k¼1
The MF detection method provides two important advantages. One of them
is low detection time requirement while the other is high detection gain. On the
other hand, this detector should have excellent prior knowledge regarding the
PU signal, and a receiver should be assigned for each PU signal.
6.4.3 Cyclostationary feature detection method
Cyclostationary Feature Detection (CFD) method employs cyclostationary
properties of the PU signals. Therefore, this method requires a priori knowledge
regarding repetitive characteristics of PU signals. In other words, the CFD
method handles the periodicity of the signals. The spectral correlation functions
are employed by the technique to determine periodicity of the PU signal. Pulse