
Page 324 - Fundamentals of Air Pollution 3E
P. 324
280 18. The Meteorological Bases of Atmospheric Pollution
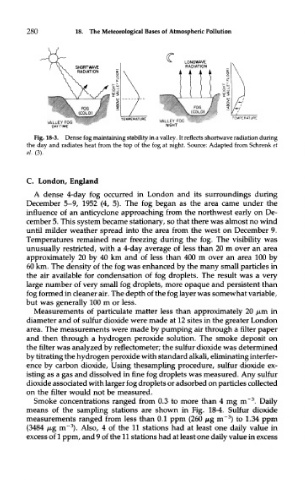
Fig. 18-3. Dense fog maintaining stability in a valley. It reflects shortwave radiation during
the day and radiates heat from the top of the fog at night. Source: Adapted from Schrenk et
al, (3).
C. London, England
A dense 4-day fog occurred in London and its surroundings during
December 5-9, 1952 (4, 5). The fog began as the area came under the
influence of an anticyclone approaching from the northwest early on De-
cember 5. This system became stationary, so that there was almost no wind
until milder weather spread into the area from the west on December 9.
Temperatures remained near freezing during the fog. The visibility was
unusually restricted, with a 4-day average of less than 20 m over an area
approximately 20 by 40 km and of less than 400 m over an area 100 by
60 km. The density of the fog was enhanced by the many small particles in
the air available for condensation of fog droplets. The result was a very
large number of very small fog droplets, more opaque and persistent than
fog formed in cleaner air. The depth of the fog layer was somewhat variable,
but was generally 100 m or less.
Measurements of particulate matter less than approximately 20 /im in
diameter and of sulfur dioxide were made at 12 sites in the greater London
area. The measurements were made by pumping air through a filter paper
and then through a hydrogen peroxide solution. The smoke deposit on
the filter was analyzed by reflectometer; the sulfur dioxide was determined
by titrating the hydrogen peroxide with standard alkali, eliminating interfer-
ence by carbon dioxide, Using thesampling procedure, sulfur dioxide ex-
isting as a gas and dissolved in fine fog droplets was measured. Any sulfur
dioxide associated with larger fog droplets or adsorbed on particles collected
on the filter would not be measured.
3
Smoke concentrations ranged from 0.3 to more than 4 mg m" . Daily
means of the sampling stations are shown in Fig. 18-4. Sulfur dioxide
3
measurements ranged from less than 0.1 ppm (260 /utg m~ ) to 1.34 ppm
3
(3484 /Ag m" ). Also, 4 of the 11 stations had at least one daily value in
excess of 1 ppm, and 9 of the 11 stations had at least one daily value in excess