
Page 325 - Fundamentals of Air Pollution 3E
P. 325
III. Meteorological Conditions during Historic Pollution Episodes 281
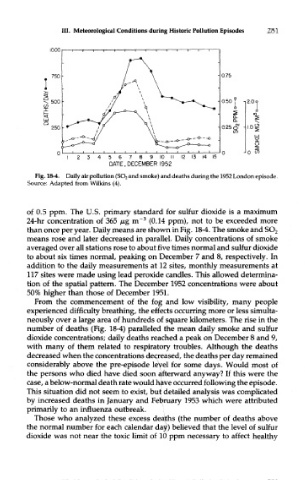
Fig. 18-4. Daily air pollution (SO 2 and smoke) and deaths during the 1952 London episode.
Source: Adapted from Wilkins (4).
of 0.5 ppm. The U.S. primary standard for sulfur dioxide is a maximum
3
24-hr concentration of 365 /u,g m~ (0.14 ppm), not to be exceeded more
than once per year. Daily means are shown in Fig. 18-4. The smoke and SO 2
means rose and later decreased in parallel. Daily concentrations of smoke
averaged over all stations rose to about five times normal and sulfur dioxide
to about six times normal, peaking on December 7 and 8, respectively. In
addition to the daily measurements at 12 sites, monthly measurements at
117 sites were made using lead peroxide candles. This allowed determina-
tion of the spatial pattern. The December 1952 concentrations were about
50% higher than those of December 1951.
From the commencement of the fog and low visibility, many people
experienced difficulty breathing, the effects occurring more or less simulta-
neously over a large area of hundreds of square kilometers. The rise in the
number of deaths (Fig. 18-4) paralleled the mean daily smoke and sulfur
dioxide concentrations; daily deaths reached a peak on December 8 and 9,
with many of them related to respiratory troubles. Although the deaths
decreased when the concentrations decreased, the deaths per day remained
considerably above the pre-episode leyel for some days. Would most of
the persons who died have died soon Afterward anyway? If this were the
case, a below-normal death rate would h^ve occurred following the episode.
This situation did not seem to exist, but detailed analysis was complicated
by increased deaths in January and February 1953 which were attributed
primarily to an influenza outbreak.
Those who analyzed these excess deaths (the number of deaths above
the normal number for each calendar da^) believed that the level of sulfur
dioxide was not near the toxic limit of 10 ppm necessary to affect healthy