
Page 321 - Fundamentals of Air Pollution 3E
P. 321
II. Stagnation 277
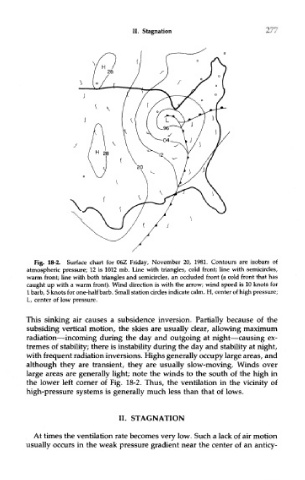
Fig. 18-2. Surface chart for 06Z Friday, November 20, 1981. Contours are isobars of
atmospheric pressure; 12 is 1012 mb. Line with triangles, cold front; line with semicircles,
warm front; line with both triangles and semicircles, an occluded front (a cold front that has
caught up with a warm front). Wind direction is with the arrow; wind speed is 10 knots for
1 barb, 5 knots for one-half barb. Small station circles indicate calm. H, center of high pressure;
L, center of low pressure.
This sinking air causes a subsidence inversion. Partially because of the
subsiding vertical motion, the skies are usually clear, allowing maximum
radiation—incoming during the day and outgoing at night—causing ex-
tremes of stability; there is instability during the day and stability at night,
with frequent radiation inversions. Highs generally occupy large areas, and
although they are transient, they are usually slow-moving. Winds over
large areas are generally light; note the winds to the south of the high in
the lower left corner of Fig. 18-2. Thus, the ventilation in the vicinity of
high-pressure systems is generally much less than that of lows.
II. STAGNATION
At times the ventilation rate becomes very low. Such a lack of air motion
usually occurs in the weak pressure gradient near the center of an anticy-