
Page 151 - Fundamentals of Air Pollution
P. 151
III. Effects on Forests 119
saplings (13). Various field investigations of forest systems in the vicinity
of large point sources show the effects of elevated SO 2 levels on the trees
closer to the source. For example, Linzon (14) found that SO 2 from the
Sudbury, Ontario (Canada), smelter caused a reduction in forest growth
over a very large area, with the closer-in trees severely defoliated, damaged,
and killed.
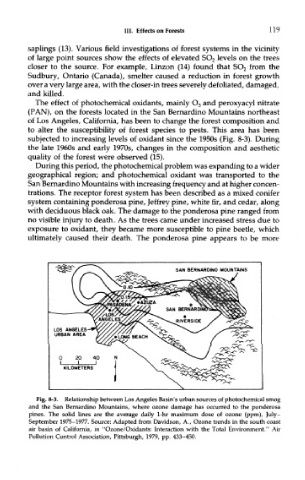
The effect of photochemical oxidants, mainly O 3 and peroxyacyl nitrate
(PAN), on the forests located in the San Bernardino Mountains northeast
of Los Angeles, California, has been to change the forest composition and
to alter the susceptibility of forest species to pests. This area has been
subjected to increasing levels of oxidant since the 1950s (Fig. 8-3). During
the late 1960s and early 1970s, changes in the composition and aesthetic
quality of the forest were observed (15).
During this period, the photochemical problem was expanding to a wider
geographical region; and photochemical oxidant was transported to the
San Bernardino Mountains with increasing frequency and at higher concen-
trations. The receptor forest system has been described as a mixed conifer
system containing ponderosa pine, Jeffrey pine, white fir, and cedar, along
with deciduous black oak. The damage to the ponderosa pine ranged from
no visible injury to death. As the trees came under increased stress due to
exposure to oxidant, they became more susceptible to pine beetle, which
ultimately caused their death. The ponderosa pine appears to be more
Fig. 8-3. Relationship between Los Angeles Basin's urban sources of photochemical smog
and the San Bernardino Mountains, where ozone damage has occurred to the ponderosa
pines. The solid lines are the average daily 1-hr maximum dose of ozone (ppm), July-
September 1975-1977. Source: Adapted from Davidson, A., Ozone trends in the south coast
air basin of California, in "Ozone/Oxidants: Interaction with the Total Environment." Air
Pollution Control Association, Pittsburgh, 1979, pp. 433-450.