
Page 73 - Fundamentals of Air Pollution
P. 73
V. Air Quality Levels 49
TABLE 4-2
Air Pollutant Concentrations at United States Sites, 1980
Maximum average concentrations in
ppb, for different averaging times
Gaseous pollutant Monitoring site % days" 1 hr 1 day 1 month 6 1 year
Carbon monoxide E. 45th St., 95 30,896 11,713 6,014 5,217
New York,
NY
Sulfur dioxide Miami, AZ 99 2,537 228 27 13
Nitrogen dioxide West St. and 95 124 78 36 29
Capitol A ve.,
Hartford, CT
Ozone N. Main St., 97 290 72 38 23
Los Angeles,
CA
" Percentage of days per year for which data were available for analysis.
* Four Weeks.
Source: U.S. Environmental Protection Agency, Research Triangle Park, NC.
1957-1967 to show this relationship (Table 4-4). The general rule that the
larger the population base, the dirtier the air will be, still exists. The air of
these cities can be expected to be cleaner in the 1990s and beyond than it
was in the 1950s and 1960s because of the tremendous efforts made to
clean up the air in the intervening decades.
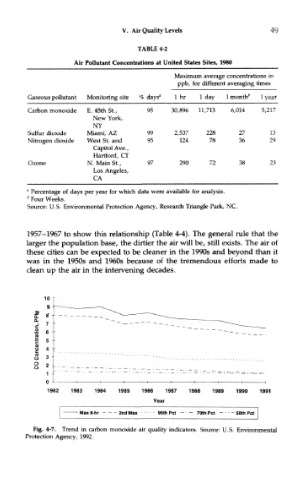
Fig. 4-7. Trend in carbon monoxide air quality indicators. Source: U.S. Environmental
Protection Agency, 1992.