
Page 74 - Fundamentals of Air Pollution
P. 74
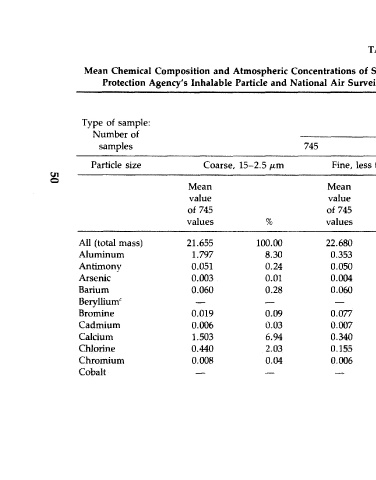
TABLE 4-3
            Mean Chemical Composition and Atmospheric Concentrations of Suspended Particulate Matter Sampled by the United States Environmental
                                                                               3
               Protection Agency's Inhalable Particle and National Air Surveillance Networks—/*g/m  and Percentage of Total Mass Sampled, 1980


            Type of sample:                                       Urban                              Rural
              Number of
               samples                           745                                2255"             133 b
             Particle size      Coarse, 15-2.5 ^m     Fine, less than 2.5 ^tm            All less than ca. 50 fj.m

                              Mean                   Mean                    Mean                    Mean
                              value                  value                   value                    value
                              of 745                 of 745                  of 2255                 of 133
                              values       %         values        %         values        %         values        %
           All (total mass)   21.655     100.00      22.680      100.00      74.990      100.00      36.504"      100.00
           Aluminum           1.797        8.30       0.353        1.56       —            —                       —
           Antimony           0.051        0.24       0.050        0.22       —            —           —           —
                                                                                                       — d
           Arsenic            0.003        0.01       0.004        0.02       0.005 C      0.01       0.003        0.01
           Barium             0.060        0.28       0.060        0.26       0.273        0.36       0.281        0.77
           Beryllium^          —           —           —          —          (0.095)       —         (0.084)       —
           Bromine            0.019        0.09       0.077        0.34       —            —                       —
                                                                                                       —
           Cadmium            0.006        0.03       0.007        0.03       0.002        0.01       0.001        0.01
           Calcium            1.503        6.94       0.340        1.50        —           —           —           —
           Chlorine           0.440        2.03       0.155        0.68       —            —           —           _-
           Chromium           0.008        0.04       0.006        0.03       0.013 C      0.02       0.015 d      0.05
           Cobalt                          —           __         __          o.oor        0.01       o.oor*       0.01
                               —