
Page 79 - Fundamentals of Air Pollution
P. 79
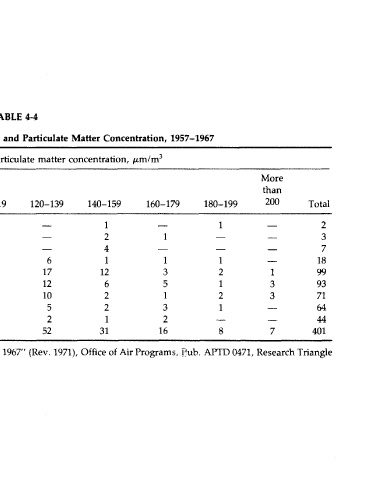
TABLE 4-4

 Distribution of Cities by Population Class and Particulate Matter Concentration, 1957-1967
 Average particulate matter concentration, /nm/m 3
 Less                                     More
 Population  than                         than
 class  40  40-59  60-79  80-99  100-119  120-139  140-159  160-179  180-199  200  Total

 Over 3 million  1                 1                2
 1 — 3 million  —  —  —  —  —  —  2  1  —  —        3
 0.7-1 million  —  —  1  —  2  —  4  —  —  —        7
 400-700,000  —  —  —  4  5  6  1  1  1    —        18
 100-400,000  —  3  7  30  24  17  12  3  2  1     99
 50-100,000  2  20  28  16  12  6  5  1     3      93
 25-50,000  —  5  24  12  12  10  2  1  2   3      71
 10-25,000  —  7  18  19  9  5  2  3  1    —       64
 Under 10,000  1  5  7  15  11  2  1  2  —  —      44
 Total  1  22  77  108  79  52  31  16  8   7      401
 Source: U.S. Environmental Protection Agency, "Air Quality Data from 1967" (Rev. 1971), Office of Air Programs, Pub, APTD 0471, Research Triangle
 Park, NC, 1971.