
Page 81 - Fundamentals of Air Pollution
P. 81
54 4. Air Quality
the total by 365, will be the same and will equal the annual arithmetic
average value. The median value will equal the arithmetic average value
only if the distribution of all values allows this to occur. For example:
12345678 9 10 Median = 5.5 Mean = 5.5
13335666 9 13 Median = 5.5 Mean = 5.5
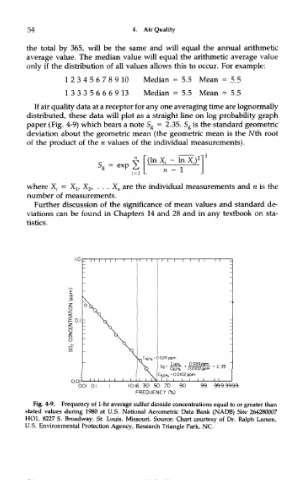
If air quality data at a receptor for any one averaging time are lognormally
distributed, these data will plot as a straight line on log probability graph
paper (Fig. 4-9) which bears a note S g = 2.35. S g is the standard geometric
deviation about the geometric mean (the geometric mean is the Nth root
of the product of the n values of the individual measurements).
where X, = X l7 X 2, . . . X n are the individual measurements and n is the
number of measurements.
Further discussion of the significance of mean values and standard de-
viations can be found in Chapters 14 and 28 and in any textbook on sta-
tistics.
Fig. 4-9. Frequency of 1-hr average sulfur dioxide concentrations equal to or greater than
stated values during 1980 at U.S. National Aerometric Data Bank (NADB) Site 264280007
HOI, 8227 S. Broadway, St. Louis. Missouri. Source: Chart courtesy of Dr. Ralph Larsen,
U.S. Environmental Protection Agency, Research Triangle Park, NC.