
Page 212 - Fundamentals of Computational Geoscience Numerical Methods and Algorithms
P. 212
8.4 Test and Application Examples of the Particle Simulation Method 203
1.00E+08
LR = 1.0m/s
8.00E+07 LR = 10m/s
Deviatoric Stress (Pa) 6.00E+07
4.00E+07
2.00E+07
0.00E+00
0.00 0.02 0.04 0.06 0.08 0.10 0.12 0.14 0.16 0.18 0.20
Axial Strain
2
(A) 1× m sample
1.00E+08
LR = 1.0m/s
8.00E+07 LR = 10m/s
Deviatoric Stress (Pa) 6.00E+07
4.00E+07
2.00E+07
0.00E+00
0.00 0.02 0.04 0.06 0.08 0.10 0.12 0.14 0.16 0.18 0.20
Axial Strain
2
(B) 1× km sample
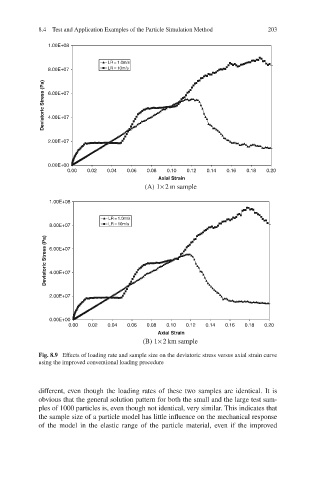
Fig. 8.9 Effects of loading rate and sample size on the deviatoric stress versus axial strain curve
using the improved conventional loading procedure
different, even though the loading rates of these two samples are identical. It is
obvious that the general solution pattern for both the small and the large test sam-
ples of 1000 particles is, even though not identical, very similar. This indicates that
the sample size of a particle model has little influence on the mechanical response
of the model in the elastic range of the particle material, even if the improved