
Page 256 - Fundamentals of Enhanced Oil and Gas Recovery
P. 256
244 Alireza Keshavarz et al.
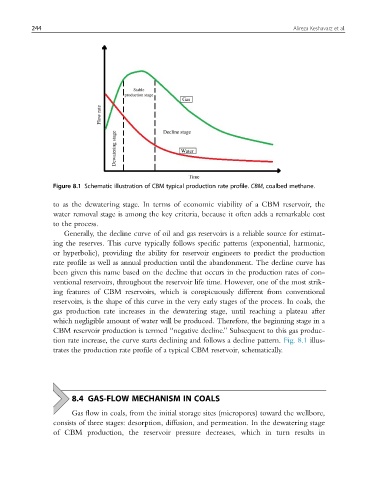
Figure 8.1 Schematic illustration of CBM typical production rate profile. CBM, coalbed methane.
to as the dewatering stage. In terms of economic viability of a CBM reservoir, the
water removal stage is among the key criteria, because it often adds a remarkable cost
to the process.
Generally, the decline curve of oil and gas reservoirs is a reliable source for estimat-
ing the reserves. This curve typically follows specific patterns (exponential, harmonic,
or hyperbolic), providing the ability for reservoir engineers to predict the production
rate profile as well as annual production until the abandonment. The decline curve has
been given this name based on the decline that occurs in the production rates of con-
ventional reservoirs, throughout the reservoir life time. However, one of the most strik-
ing features of CBM reservoirs, which is conspicuously different from conventional
reservoirs, is the shape of this curve in the very early stages of the process. In coals, the
gas production rate increases in the dewatering stage, until reaching a plateau after
which negligible amount of water will be produced. Therefore, the beginning stage in a
CBM reservoir production is termed “negative decline.” Subsequent to this gas produc-
tion rate increase, the curve starts declining and follows a decline pattern. Fig. 8.1 illus-
trates the production rate profile of a typical CBM reservoir, schematically.
8.4 GAS-FLOW MECHANISM IN COALS
Gas flow in coals, from the initial storage sites (micropores) toward the wellbore,
consists of three stages: desorption, diffusion, and permeation. In the dewatering stage
of CBM production, the reservoir pressure decreases, which in turn results in