
Page 293 - Fundamentals of Enhanced Oil and Gas Recovery
P. 293
Enhanced Oil Recovery (EOR) in Shale Oil Reservoirs 281
9.3.2.3 Field Test of Water Injection
Water injection process was started in 2006 in Bakken and Lower Shaunavon forma-
tions. The injection patterns were such that horizontal injectors paralleled horizontal
producers with their spacing of hundreds of meters [60]. Later a simulation study was
conducted for a Lower Shaunavon of 1 injector and 18 producers. After 50 years, the
recovery factor was predicted to be 5.1% [61].
Water was injected by Meridian Oil in the Bicentennial Field in McKenzie
County in 1994. Approximately 13,200 barrels of freshwater were injected into a hor-
izontal well in the Upper Bakken Shale for 50 days, then the soaking time was 60
days, after soaking period, oil production remained below the rates before water
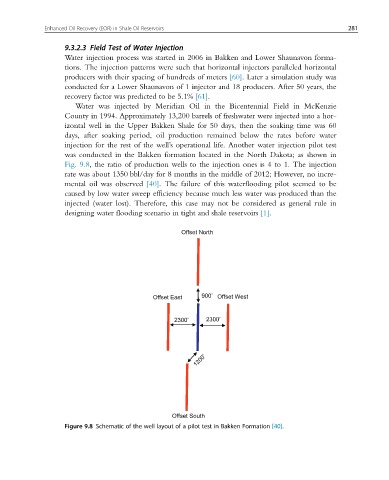
injection for the rest of the well’s operational life. Another water injection pilot test
was conducted in the Bakken formation located in the North Dakota; as shown in
Fig. 9.8, the ratio of production wells to the injection ones is 4 to 1. The injection
rate was about 1350 bbl/day for 8 months in the middle of 2012; However, no incre-
mental oil was observed [40]. The failure of this waterflooding pilot seemed to be
caused by low water sweep efficiency because much less water was produced than the
injected (water lost). Therefore, this case may not be considered as general rule in
designing water flooding scenario in tight and shale reservoirs [1].
Offset North
Offset East 900’ Offset West
2300’ 2300’
1200’
Offset South
Figure 9.8 Schematic of the well layout of a pilot test in Bakken Formation [40].