
Page 375 - Fundamentals of Gas Shale Reservoirs
P. 375
ESTIMATION OF BRINE IMBIBITION AT THE FIELD SCALE 355
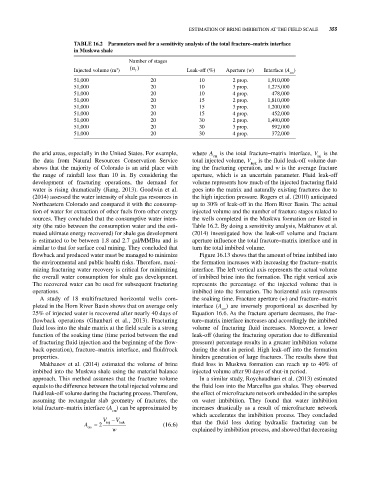
TABLE 16.2 Parameters used for a sensitivity analysis of the total fracture–matrix interface
in Muskwa shale
Number of stages
()
n
3
Injected volume (m ) f Leak‐off (%) Aperture (w) Interface (A )
cm
51,000 20 10 2 prop. 1,910,000
51,000 20 10 3 prop. 1,275,000
51,000 20 10 4 prop. 478,000
51,000 20 15 2 prop. 1,810,000
51,000 20 15 3 prop. 1,200,000
51,000 20 15 4 prop. 452,000
51,000 20 30 2 prop. 1,490,000
51,000 20 30 3 prop. 992,000
51,000 20 30 4 prop. 372,000
the arid areas, especially in the United States. For example, where A is the total fracture–matrix interface, V is the
cm
inj
the data from Natural Resources Conservation Service total injected volume, V is the fluid leak‐off volume dur-
leak
shows that the majority of Colorado is an arid place with ing the fracturing operation, and w is the average fracture
the range of rainfall less than 10 in. By considering the aperture, which is an uncertain parameter. Fluid leak‐off
development of fracturing operations, the demand for volume represents how much of the injected fracturing fluid
water is rising dramatically (Jiang, 2013). Goodwin et al. goes into the matrix and naturally existing fractures due to
(2014) assessed the water intensity of shale gas resources in the high injection pressure. Rogers et al. (2010) anticipated
Northeastern Colorado and compared it with the consump- up to 30% of leak‐off in the Horn River Basin. The actual
tion of water for extraction of other fuels from other energy injected volume and the number of fracture stages related to
sources. They concluded that the consumptive water inten- the wells completed in the Muskwa formation are listed in
sity (the ratio between the consumption water and the esti- Table 16.2. By doing a sensitivity analysis, Makhanov et al.
mated ultimate energy recovered) for shale gas development (2014) investigated how the leak‐off volume and fracture
is estimated to be between 1.8 and 2.7 gal/MMBtu and is aperture influence the total fracture–matrix interface and in
similar to that for surface coal mining. They concluded that turn the total imbibed volume.
flowback and produced water must be managed to minimize Figure 16.13 shows that the amount of brine imbibed into
the environmental and public health risks. Therefore, maxi- the formation increases with increasing the fracture–matrix
mizing fracturing water recovery is critical for minimizing interface. The left vertical axis represents the actual volume
the overall water consumption for shale gas development. of imbibed brine into the formation. The right vertical axis
The recovered water can be used for subsequent fracturing represents the percentage of the injected volume that is
operations. imbibed into the formation. The horizontal axis represents
A study of 18 multifractured horizontal wells com- the soaking time. Fracture aperture (w) and fracture–matrix
pleted in the Horn River Basin shows that on average only interface (A ) are inversely proportional as described by
cm
25% of injected water is recovered after nearly 40 days of Equation 16.6. As the fracture aperture decreases, the frac-
flowback operations (Ghanbari et al., 2013). Fracturing ture–matrix interface increases and accordingly the imbibed
fluid loss into the shale matrix at the field scale is a strong volume of fracturing fluid increases. Moreover, a lower
function of the soaking time (time period between the end leak‐off (during the fracturing operation due to differential
of fracturing fluid injection and the beginning of the flow- pressure) percentage results in a greater imbibition volume
back operation), fracture–matrix interface, and fluid/rock during the shut‐in period. High leak‐off into the formation
properties. hinders generation of large fractures. The results show that
Makhanov et al. (2014) estimated the volume of brine fluid loss in Muskwa formation can reach up to 40% of
imbibed into the Muskwa shale using the material balance injected volume after 90 days of shut‐in period.
approach. This method assumes that the fracture volume In a similar study, Roychaudhuri et al. (2013) estimated
equals to the difference between the total injected volume and the fluid loss into the Marcellus gas shales. They observed
fluid leak‐off volume during the fracturing process. Therefore, the effect of microfracture network embedded in the samples
assuming the rectangular slab geometry of fractures, the on water imbibition. They found that water imbibition
total fracture–matrix interface (A ) can be approximated by increases drastically as a result of microfracture network
cm
which accelerates the imbibition process. They concluded
V V
A 2 inj leak (16.6) that the fluid loss during hydraulic fracturing can be
cm
w explained by imbibition process, and showed that decreasing