
Page 371 - Fundamentals of Gas Shale Reservoirs
P. 371
FACTORS INFLUENCING WATER IMBIBITION IN SHALES 351
oil (kerosene), which hardly imbibes into intact samples of 16.4.7 Effect of Polymer and Surfactant
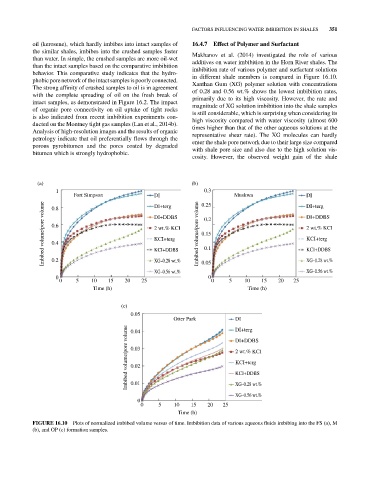
the similar shales, imbibes into the crushed samples faster Makhanov et al. (2014) investigated the role of various
than water. In simple, the crushed samples are more oil‐wet additives on water imbibition in the Horn River shales. The
than the intact samples based on the comparative imbibition imbibition rate of various polymer and surfactant solutions
behavior. This comparative study indicates that the hydro- in different shale members is compared in Figure 16.10.
phobic pore network of the intact samples is poorly connected. Xanthan Gum (XG) polymer solution with concentrations
The strong affinity of crushed samples to oil is in agreement of 0.28 and 0.56 wt.% shows the lowest imbibition rates,
with the complete spreading of oil on the fresh break of primarily due to its high viscosity. However, the rate and
intact samples, as demonstrated in Figure 16.2. The impact magnitude of XG solution imbibition into the shale samples
of organic pore connectivity on oil uptake of tight rocks is still considerable, which is surprising when considering its
is also indicated from recent imbibition experiments con- high viscosity compared with water viscosity (almost 600
ducted on the Montney tight gas samples (Lan et al., 2014b). times higher than that of the other aqueous solutions at the
Analysis of high‐resolution images and the results of organic representative shear rate). The XG molecules can hardly
petrology indicate that oil preferentially flows through the enter the shale pore network due to their large size compared
porous pyrobitumen and the pores coated by degraded with shale pore size and also due to the high solution vis-
bitumen which is strongly hydrophobic.
cosity. However, the observed weight gain of the shale
(a) (b)
1 0.3
Fort Simpson DI 0.25 Muskwa DI
Imbibed volume/pore volume 0.6 DI+DDBS Imbibed volume/pore volume 0.15 DI+DDBS
DI+terg
DI+terg
0.8
0.2
2 wt.% KCI
2 wt.% KCI
KCI+terg
KCI+terg
0.4
0.1
KCI+DDBS
KCI+DDBS
0.2
XG–0.28 wt.%
XG–0.56 wt.%
XG–0.56 wt.% 0.05 XG–0.28 wt.%
0 0
0 5 10 15 20 25 0 5 10 15 20 25
Time (h) Time (h)
(c)
0.05
Otter Park DI
Imbibed volume/pore volume 0.03 DI+DDBS
DI+terg
0.04
2 wt.% KCI
KCI+terg
0.02
KCI+DDBS
0.01
XG–0.28 wt.%
XG–0.56 wt.%
0
0 5 10 15 20 25
Time (h)
FIGURE 16.10 Plots of normalized imbibed volume versus of time. Imbibition data of various aqueous fluids imbibing into the FS (a), M
(b), and OP (c) formation samples.