
Page 367 - Fundamentals of Gas Shale Reservoirs
P. 367
FACTORS INFLUENCING WATER IMBIBITION IN SHALES 347
(a) 0.4 Fort Simpson (b) 0.4 Muskwa
Imbibed volume/surface area (cm) 0.3 Imbibition along the bedding plane Imbibed volume/surface area (cm) 0.3 Imbibition along the bedding plane
Imbibition across the bedding plane
0.2
0.2
Imbibition across the bedding plane
0.1
0.1
0
0 5 10 15 20 25 0 0 5 10 15 20 25
Time (h) Time (h)
(c) 0.4 Otter Park
Imbibed volume/surface area (cm) 0.3 Imbibition along the bedding plane
Imbibition across the bedding plane
0.2
0.1
0
10
0
5
15
Time (h) 20 25
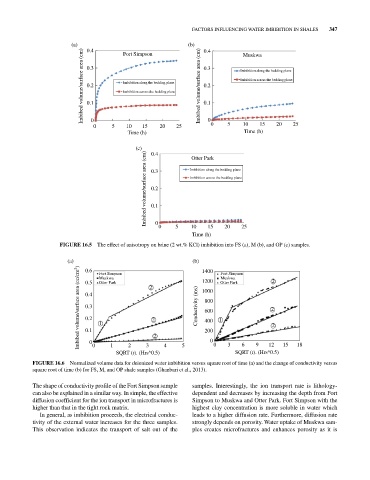
FIGURE 16.5 The effect of anisotropy on brine (2 wt.% KCl) imbibition into FS (a), M (b), and OP (c) samples.
(a) 0.6 Fort Simpson (b) 1400 Fort Simpson 2
Imbibed volume/surface area (cc/cm 2 ) 0.4 1 2 2 Conductivity (ms) 1000 1 2 2
Muskwa
Muskwa
1200
0.5
Otter Park
Otter Park
800
0.3
600
0.2
400
200
0.1
2
0
6
9
12
0
1
2
3
SQRT (t). (Hrs^0.5) 4 5 0 0 3 SQRT (t). (Hrs^0.5) 15 18
FIGURE 16.6 Normalized volume data for deionized water imbibition versus square root of time (a) and the change of conductivity versus
square root of time (b) for FS, M, and OP shale samples (Ghanbari et al., 2013).
The shape of conductivity profile of the Fort Simpson sample samples. Interestingly, the ion transport rate is lithology‐
can also be explained in a similar way. In simple, the effective dependent and decreases by increasing the depth from Fort
diffusion coefficient for the ion transport in microfractures is Simpson to Muskwa and Otter Park. Fort Simpson with the
higher than that in the tight rock matrix. highest clay concentration is more soluble in water which
In general, as imbibition proceeds, the electrical conduc- leads to a higher diffusion rate. Furthermore, diffusion rate
tivity of the external water increases for the three samples. strongly depends on porosity. Water uptake of Muskwa sam-
This observation indicates the transport of salt out of the ples creates microfractures and enhances porosity as it is