
Page 365 - Fundamentals of Gas Shale Reservoirs
P. 365
FACTORS INFLUENCING WATER IMBIBITION IN SHALES 345
(a) (b)
48˚
1 mm
(c) (d)
58˚
(e) (f)
73˚
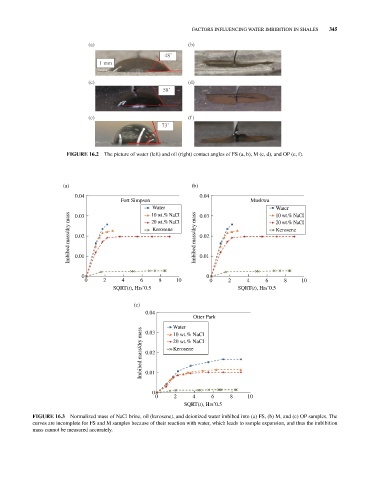
FIGURE 16.2 The picture of water (left) and oil (right) contact angles of FS (a, b), M (c, d), and OP (e, f).
(a) (b)
0.04 0.04
Fort Simpson Muskwa
Water 0.03 Water
10 wt.% NaCI
Imbibed mass/dry mass 0.02 Kerosene Imbibed mass/dry mass 0.02 Kerosene
10 wt.% NaCI
0.03
20 wt.% NaCI
20 wt.% NaCI
0.01
0.01
0 0
0 2 4 6 8 10 0 2 4 6 8 10
SQRT(t), Hrsˆ0.5 SQRT(t), Hrsˆ0.5
(c)
0.04
Otter Park
Water
Imbibed mass/dry mass 0.02 20 wt.% NaCI
0.03
10 wt.% NaCI
Kerosene
0.01
0
0 2 4 6 8 10
SQRT(t), Hrsˆ0.5
FIGURE 16.3 Normalized mass of NaCl brine, oil (kerosene), and deionized water imbibed into (a) FS, (b) M, and (c) OP samples. The
curves are incomplete for FS and M samples because of their reaction with water, which leads to sample expansion, and thus the imbibition
mass cannot be measured accurately.