
Page 366 - Fundamentals of Gas Shale Reservoirs
P. 366
346 WETTABILITY OF GAS SHALE RESERVOIRS
(a) (b)
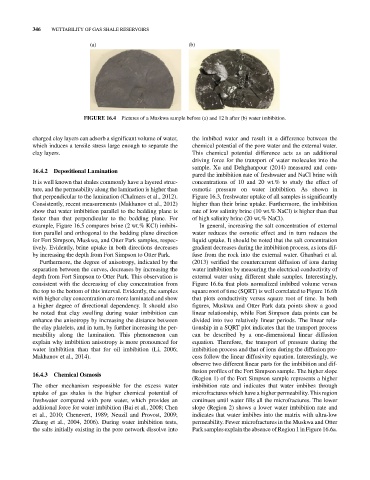
FIGURE 16.4 Pictures of a Muskwa sample before (a) and 12 h after (b) water imbibition.
charged clay layers can adsorb a significant volume of water, the imbibed water and result in a difference between the
which induces a tensile stress large enough to separate the chemical potential of the pore water and the external water.
clay layers. This chemical potential difference acts as an additional
driving force for the transport of water molecules into the
sample. Xu and Dehghanpour (2014) measured and com-
16.4.2 Depositional Lamination
pared the imbibition rate of freshwater and NaCl brine with
It is well known that shales commonly have a layered struc- concentrations of 10 and 20 wt.% to study the effect of
ture, and the permeability along the lamination is higher than osmotic pressure on water imbibition. As shown in
that perpendicular to the lamination (Chalmers et al., 2012). Figure 16.3, freshwater uptake of all samples is significantly
Consistently, recent measurements (Makhanov et al., 2012) higher than their brine uptake. Furthermore, the imbibition
show that water imbibition parallel to the bedding plane is rate of low salinity brine (10 wt.% NaCl) is higher than that
faster than that perpendicular to the bedding plane. For of high salinity brine (20 wt.% NaCl).
example, Figure 16.5 compares brine (2 wt.% KCl) imbibi- In general, increasing the salt concentration of external
tion parallel and orthogonal to the bedding plane direction water reduces the osmotic effect and in turn reduces the
for Fort Simpson, Muskwa, and Otter Park samples, respec- liquid uptake. It should be noted that the salt concentration
tively. Evidently, brine uptake in both directions decreases gradient decreases during the imbibition process, as ions dif-
by increasing the depth from Fort Simpson to Otter Park. fuse from the rock into the external water. Ghanbari et al.
Furthermore, the degree of anisotropy, indicated by the (2013) verified the countercurrent diffusion of ions during
separation between the curves, decreases by increasing the water imbibition by measuring the electrical conductivity of
depth from Fort Simpson to Otter Park. This observation is external water using different shale samples. Interestingly,
consistent with the decreasing of clay concentration from Figure 16.6a that plots normalized imbibed volume versus
the top to the bottom of this interval. Evidently, the samples square root of time (SQRT) is well correlated to Figure 16.6b
with higher clay concentration are more laminated and show that plots conductivity versus square root of time. In both
a higher degree of directional dependency. It should also figures, Muskwa and Otter Park data points show a good
be noted that clay swelling during water imbibition can linear relationship, while Fort Simpson data points can be
enhance the anisotropy by increasing the distance between divided into two relatively linear periods. The linear rela-
the clay platelets, and in turn, by further increasing the per- tionship in a SQRT plot indicates that the transport process
meability along the lamination. This phenomenon can can be described by a one‐dimensional linear diffusion
explain why imbibition anisotropy is more pronounced for equation. Therefore, the transport of pressure during the
water imbibition than that for oil imbibition (Li, 2006; imbibition process and that of ions during the diffusion pro-
Makhanov et al., 2014). cess follow the linear diffusivity equation. Interestingly, we
observe two different linear parts for the imbibition and dif-
fusion profiles of the Fort Simpson sample. The higher slope
16.4.3 Chemical Osmosis
(Region 1) of the Fort Simpson sample represents a higher
The other mechanism responsible for the excess water imbibition rate and indicates that water imbibes through
uptake of gas shales is the higher chemical potential of microfractures which have a higher permeability. This region
freshwater compared with pore water, which provides an continues until water fills all the microfractures. The lower
additional force for water imbibition (Bai et al., 2008; Chen slope (Region 2) shows a lower water imbibition rate and
et al., 2010; Chenevert, 1989; Neuzil and Provost, 2009; indicates that water imbibes into the matrix with ultra‐low
Zhang et al., 2004, 2006). During water imbibition tests, permeability. Fewer microfractures in the Muskwa and Otter
the salts initially existing in the pore network dissolve into Park samples explain the absence of Region 1 in Figure 16.6a.