
Page 368 - Fundamentals of Gas Shale Reservoirs
P. 368
348 WETTABILITY OF GAS SHALE RESERVOIRS
shown for example in Figure 16.4. The increase in porosity water uptake is strongly correlated to the concentration of
results in a lower tortuosity value, and in turn, in a higher illite, which is the dominant clay mineral. Although, illite is
effective diffusion coefficient. In addition, when the porosity conventionally known as a nonswelling clay, this correlation
is very low, surface interaction between the ions and shale indicates the effect of water adsorption on water uptake of gas
minerals dominates. As porosity increases, surface interac- shales. This is not a new observation, as previous experiments
tion becomes less important and diffusion rate increases. show that water adsorption can even alter illitic shales
Furthermore, the results of diffusion experiments can be (Chenevert, 1989; Hensen and Smit, 2002). In addition, the
used to explain the gradual increase in salt concentration presence of a small amount of mixed layer clay (interlayered
of produced water during flowback operations (Sharak et al., or interstratified mixtures of illite and montmorillonite) may
2014). Moreover, Fakcharoenphol et al. (2014) showed that be the possible reason for the observed alteration. It is known
osmotic potential can also lead to excess water imbibition that the hydration tendency of mixed layer clays is greater
and countercurrent oil release in oil‐saturated shales. than that of illite (Hensen and Smit, 2002).
Furthermore, Makhanov et al. (2014) observed that imbi-
16.4.4 Water Film and Salt Crystals bition of KCl brine is less than that of DI (deionized) water,
which is another sign of water adsorption by clay minerals.
The strong affinity of dry shales to water can partly be due to Imbibition in shales is affected by the presence of potassium
the presence of water (or brine) film and/or salt crystals ini- ions, which act as a clay swelling inhibitor. The potassium
tially coating the rock pore network. Although the earlier ion (K ) can replace cations already present in the shale
+
experiments were conducted on dehydrated shale samples, structure. Low hydration energy of (K ) inhibits the reaction
+
parts of the pore space, originally saturated with water, may of clays with water molecules, hence it helps to keep the
still be coated by a film of water. In addition, the salt initially shale structure intact. Since KCl brine inhibits clay swelling
dissolved in the pore brine may form salt crystals coating the and microfracture generation, it results in a reduced imbibi-
surface of pore network. The possible salt precipitates in the tion rate as compared to freshwater. In a similar study, Xu
pore space can stabilize the water film (Hematfar et al., and Dehghanpour (2014) showed that increasing NaCl
2013). The affinity of the pore surface coated by a brine film concentration can significantly reduce the alteration degree
to water is stronger than that to oil (Schenk et al., 2006).
of gas shales, as shown in Figure 16.8.
Morsy and Sheng (2014) observed that clay swelling and
16.4.5 Water Adsorption (Clay Swelling)
induced cracks due to the imbibition of distilled water and a
Clay minerals of shales can adsorb a considerable amount of low pH aqueous solution can help oil production from
water, and the degree of adsorption depends on clay chemistry Barnett shale samples with relatively high illite concentration.
and water salinity (Chenevert, 1970; Hensen and Smit, 2002). They concluded that clay swelling can contribute to oil
This adsorption is partly due to the attraction of polar water recovery by creating cracks along the depositional limita-
molecules by negatively charged clay platelets, and thus this tion. In a similar study, Morsy et al. (2014b) studied the
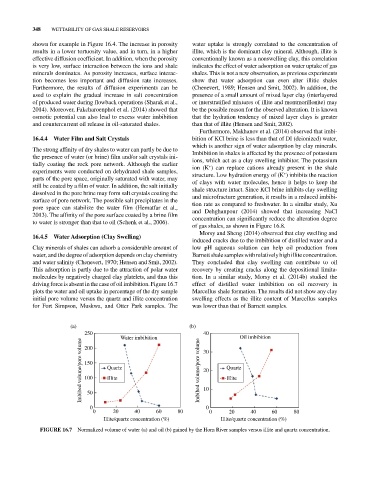
driving force is absent in the case of oil imbibition. Figure 16.7 effect of distilled water imbibition on oil recovery in
plots the water and oil uptake in percentage of the dry sample Marcellus shale formation. The results did not show any clay
initial pore volume versus the quartz and illite concentration swelling effects as the illite content of Marcellus samples
for Fort Simpson, Muskwa, and Otter Park samples. The was lower than that of Barnett samples.
(a) (b)
250 Water imbibition 40 Oil imbibition
Imbibed volume/pore volume 150 Quartz Imbibed volume/pore volume 20 Quartz
200
30
100
Illite
Illite
10
50
0 0
0 20 40 60 80 0 20 40 60 80
Illite/quartz concentration (%) Illite/quartz concentration (%)
FIGURE 16.7 Normalized volume of water (a) and oil (b) gained by the Horn River samples versus illite and quartz concentration.