
Page 363 - Fundamentals of Gas Shale Reservoirs
P. 363
FACTORS INFLUENCING WATER IMBIBITION IN SHALES 343
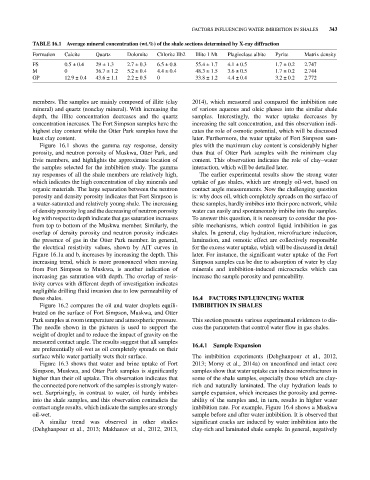
TABLE 16.1 Average mineral concentration (wt.%) of the shale sections determined by X‐ray diffraction
Formation Calcite Quartz Dolomite Chlorite IIb2 Illite 1 Mt Plagioclase albite Pyrite Matrix density
FS 0.5 ± 0.4 29 ± 1.3 2.7 ± 0.3 6.5 ± 0.8 55.4 ± 1.7 4.1 ± 0.5 1.7 ± 0.2 2.747
M 0 36.7 ± 1.2 5.2 ± 0.4 4.4 ± 0.4 48.3 ± 1.5 3.6 ± 0.5 1.7 ± 0.2 2.744
OP 12.9 ± 0.4 43.6 ± 1.1 2.2 ± 0.5 0 33.8 ± 1.2 4.4 ± 0.4 3.2 ± 0.2 2.772
members. The samples are mainly composed of illite (clay 2014), which measured and compared the imbibition rate
mineral) and quartz (nonclay mineral). With increasing the of various aqueous and oleic phases into the similar shale
depth, the illite concentration decreases and the quartz samples. Interestingly, the water uptake decreases by
concentration increases. The Fort Simpson samples have the increasing the salt concentration, and this observation indi-
highest clay content while the Otter Park samples have the cates the role of osmotic potential, which will be discussed
least clay content. later. Furthermore, the water uptake of Fort Simpson sam-
Figure 16.1 shows the gamma ray response, density ples with the maximum clay content is considerably higher
porosity, and neutron porosity of Muskwa, Otter Park, and than that of Otter Park samples with the minimum clay
Evie members, and highlights the approximate location of content. This observation indicates the role of clay–water
the samples selected for the imbibition study. The gamma interaction, which will be detailed later.
ray responses of all the shale members are relatively high, The earlier experimental results show the strong water
which indicates the high concentration of clay minerals and uptake of gas shales, which are strongly oil‐wet, based on
organic materials. The large separation between the neutron contact angle measurements. Now the challenging question
porosity and density porosity indicates that Fort Simpson is is: why does oil, which completely spreads on the surface of
a water‐saturated and relatively young shale. The increasing these samples, hardly imbibes into their pore network, while
of density porosity log and the decreasing of neutron porosity water can easily and spontaneously imbibe into the samples.
log with respect to depth indicate that gas saturation increases To answer this question, it is necessary to consider the pos-
from top to bottom of the Muskwa member. Similarly, the sible mechanisms, which control liquid imbibition in gas
overlap of density porosity and neutron porosity indicates shales. In general, clay hydration, microfracture induction,
the presence of gas in the Otter Park member. In general, lamination, and osmotic effect are collectively responsible
the electrical resistivity values, shown by AIT curves in for the excess water uptake, which will be discussed in detail
Figure 16.1a and b, increases by increasing the depth. This later. For instance, the significant water uptake of the Fort
increasing trend, which is more pronounced when moving Simpson samples can be due to adsorption of water by clay
from Fort Simpson to Muskwa, is another indication of minerals and imbibition‐induced microcracks which can
increasing gas saturation with depth. The overlap of resis- increase the sample porosity and permeability.
tivity curves with different depth of investigation indicates
negligible drilling fluid invasion due to low permeability of
these shales. 16.4 FACTORS INFLUENCING WATER
Figure 16.2 compares the oil and water droplets equili- IMBIBITION IN SHALES
brated on the surface of Fort Simpson, Muskwa, and Otter
Park samples at room temperature and atmospheric pressure. This section presents various experimental evidences to dis-
The needle shown in the pictures is used to support the cuss the parameters that control water flow in gas shales.
weight of droplet and to reduce the impact of gravity on the
measured contact angle. The results suggest that all samples 16.4.1 Sample Expansion
are preferentially oil‐wet as oil completely spreads on their
surface while water partially wets their surface. The imbibition experiments (Dehghanpour et al., 2012,
Figure 16.3 shows that water and brine uptake of Fort 2013; Morsy et al., 2014a) on unconfined and intact core
Simpson, Muskwa, and Otter Park samples is significantly samples show that water uptake can induce microfractures in
higher than their oil uptake. This observation indicates that some of the shale samples, especially those which are clay‐
the connected pore network of the samples is strongly water‐ rich and naturally laminated. The clay hydration leads to
wet. Surprisingly, in contrast to water, oil hardy imbibes sample expansion, which increases the porosity and perme-
into the shale samples, and this observation contradicts the ability of the samples and, in turn, results in higher water
contact angle results, which indicate the samples are strongly imbibition rate. For example, Figure 16.4 shows a Muskwa
oil‐wet. sample before and after water imbibition. It is observed that
A similar trend was observed in other studies significant cracks are induced by water imbibition into the
(Dehghanpour et al., 2013; Makhanov et al., 2012, 2013, clay‐rich and laminated shale sample. In general, negatively