
Page 71 - Fundamentals of Gas Shale Reservoirs
P. 71
SAMPLE TYPE AND QUALITY 51
to volatilization and evaporation of hydrocarbons during Rock‐Eval 6 instruments have 25–35% lower free‐oil
drilling operations, sample retrieval, handling, storage, and yields as shown by the Norwegian Petroleum Directorate
sample preparation prior to analysis. (NIGOGA, 2000). The organic carbon dioxide (S3) released
from kerogen is about the same in all samples. While it
might be inferred that there was a difference in organofacies
3.4 SAMPLE TYPE AND QUALITY between the wells, the projected HI values from a linear fit
of pyrolysis yields (S2) to TOC was 430 and 423 mg/g TOC,
Oftentimes, geochemical reconnaissance work is completed respectively, suggesting no organofacies differences. As sug
on archived cuttings that have been stored for years to gested earlier, the source of difference may be the result of
decades. Core is sometimes available, but in the past cores oxidation of the old samples as the carbonate carbon yields
were seldom taken in shales. Comparison of archived cut increased by a factor of 3. Although the flame ionization
tings to fresh cuttings and core often show lower values in detector (FID) does not respond to carbon dioxide, it is likely
basic geochemical measurements such as TOC, Rock‐Eval, that the increase in nonhydrocarbon gases such as carbon
and vitrinite reflectance for the older samples (Jarvie et al., dioxide released into the S2 effluent during pyrolysis dilutes,
2007; Steward, 2007). This was noted in Barnett Shale wells and thereby reduces the FID response in the old cuttings. In
drilled by Mitchell Energy & Development Corp. (MEDC) other work, highly weathered outcrop samples may cause
when wells were offset and cored (Steward, 2007). the FID flame to be extinguished.
In 2011, an independent oil company, Gunn Oil Co., Other data published by the Arkansas Geological Survey
drilled a well in Fisher County, Texas, that offset a well shows that cuttings data on the Fayetteville Shale often
drilled in the 1980s, both of which penetrated Pennsylvanian reflect a mixture of overlying organic lean rock (cavings)
period shales. A comparison of fresh core and cuttings to the with Fayetteville Shale. Values typical of the Fayetteville
archived cuttings shows significant changes in geochemical Shale are often reached about 30–50 ft into the shale (Li
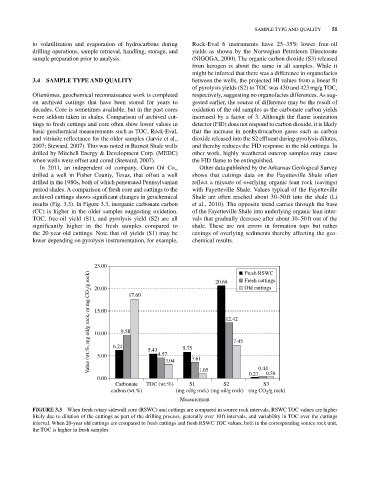
results (Fig. 3.3). In Figure 3.3, inorganic carbonate carbon et al., 2010). The opposite trend carries through the base
(CC) is higher in the older samples suggesting oxidation. of the Fayetteville Shale into underlying organic lean inter
TOC, free‐oil yield (S1), and pyrolysis yield (S2) are all vals that gradually decrease after about 30–50 ft out of the
significantly higher in the fresh samples compared to shale. These are not errors in formation tops but rather
the 20‐year‐old cuttings. Note that oil yields (S1) may be cavings of overlying sediments thereby affecting the geo
lower depending on pyrolysis instrumentation, for example, chemical results.
25.00 20.68 Fresh RSWC
Value (wt.%, mg oil/g rock, or mg CO 2 /g rock) 15.00 6.24 9.58 17.60 5.43 5.75 12.42
Fresh cuttings
Old cuttings
20.00
10.00
7.45
5.00
0.00 4.57 3.04 3.61 1.05 0.27 0.44 0.38
Carbonate TOC (wt.%) S1 S2 S3
carbon (wt.%) (mg oil/g rock) (mg oil/g rock) (mg CO /g rock)
2
Measurement
FIGURE 3.3 When fresh rotary sidewall core (RSWC) and cuttings are compared in source rock intervals, RSWC TOC values are higher
likely due to dilution of the cuttings as part of the drilling process, generally over 10 ft intervals, and variability in TOC over the cuttings
interval. When 20‐year old cuttings are compared to fresh cuttings and fresh RSWC TOC values, both in the corresponding source rock unit,
the TOC is higher in fresh samples.