
Page 76 - Fundamentals of Gas Shale Reservoirs
P. 76
56 GEOCHEMICAL ASSESSMENT OF UNCONVENTIONAL SHALE GAS RESOURCE SYSTEMS
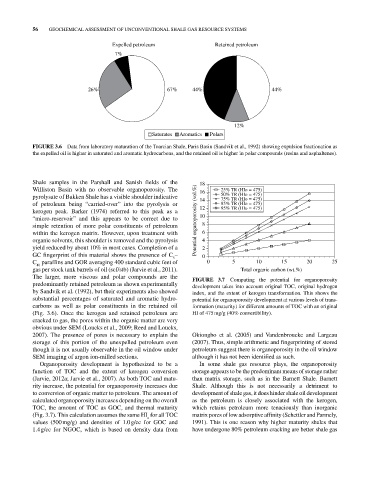
Expelled petroleum Retained petroleum
7%
26% 67% 44% 44%
12%
Saturates Aromatics Polars
FIGURE 3.6 Data from laboratory maturation of the Toarcian Shale, Paris Basin (Sandvik et al., 1992) showing expulsion fractionation as
the expelled oil is higher in saturated and aromatic hydrocarbons, and the retained oil is higher in polar compounds (resins and asphaltenes).
Shale samples in the Parshall and Sanish fields of the 18
Williston Basin with no observable organoporosity. The 16 25% TR (HIo=475)
pyrolysate of Bakken Shale has a visible shoulder indicative 14 50% TR (HIo=475)
75% TR (HIo=475)
of petroleum being “carried‐over” into the pyrolysis or 85% TR (HIo=475)
kerogen peak. Barker (1974) referred to this peak as a 12 95% TR (HIo=475)
“micro‐reservoir” and this appears to be correct due to Potential organoporosity (vol.%) 10
simple retention of more polar constituents of petroleum 8
within the kerogen matrix. However, upon treatment with 6
organic solvents, this shoulder is removed and the pyrolysis 4
yield reduced by about 10% in most cases. Completion of a 2
GC fingerprint of this material shows the presence of C – 0
5
C paraffins and GOR averaging 400 standard cubic feet of 0 5 10 15 20 25
40
gas per stock tank barrels of oil (scf/stb) (Jarvie et al., 2011). Total organic carbon (wt.%)
The larger, more viscous and polar compounds are the FIGURE 3.7 Computing the potential for organoporosity
predominantly retained petroleum as shown experimentally development takes into account original TOC, original hydrogen
by Sandvik et al. (1992), but their experiments also showed index, and the extent of kerogen transformation. This shows the
substantial percentages of saturated and aromatic hydro potential for organoporosity development at various levels of trans
carbons as well as polar constituents in the retained oil formation (maturity) for different amounts of TOC with an original
(Fig. 3.6). Once the kerogen and retained petroleum are HI of 475 mg/g (40% convertibility).
cracked to gas, the pores within the organic matter are very
obvious under SEM (Loucks et al., 2009; Reed and Loucks,
2007). The presence of pores is necessary to explain the Okiongbo et al. (2005) and Vandenbroucke and Largeau
storage of this portion of the unexpelled petroleum even (2007). Thus, simple arithmetic and fingerprinting of stored
though it is not usually observable in the oil window under petroleum suggest there is organoporosity in the oil window
SEM imaging of argon ion‐milled sections. although it has not been identified as such.
Organoporosity development is hypothesized to be a In some shale gas resource plays, the organoporosity
function of TOC and the extent of kerogen conversion storage appears to be the predominant means of storage rather
(Jarvie, 2012a; Jarvie et al., 2007). As both TOC and matu than matrix storage, such as in the Barnett Shale. Barnett
rity increase, the potential for organoporosity increases due Shale. Although this is not necessarily a detriment to
to conversion of organic matter to petroleum. The amount of development of shale gas, it does hinder shale oil development
calculated organoporosity increases depending on the overall as the petroleum is closely associated with the kerogen,
TOC, the amount of TOC as GOC, and thermal maturity which retains petroleum more tenaciously than inorganic
(Fig. 3.7). This calculation assumes the same HI for all TOC matrix pores of low adsorptive affinity (Schettler and Parmely,
o
values (500 mg/g) and densities of 1.0 g/cc for GOC and 1991). This is one reason why higher maturity shales that
1.4 g/cc for NGOC, which is based on density data from have undergone 80% petroleum cracking are better shale gas