Page 80 - Fundamentals of Gas Shale Reservoirs
P. 80

60   GEOCHEMICAL ASSESSMENT OF UNCONVENTIONAL SHALE GAS RESOURCE SYSTEMS

               2.5                                                  1.00
                    Barnett Shale kerogen and polars-derived gas                     Barnett Shale (kerogen and polars cracking)
                    Barnett Shale hydrocarbons and polars-derived gas                Barnett Shale (nonpolars cracking)
               2.0                                                  0.95


             i-C 4 /n-C 4  1.5                                    Dry gas ratio (C 1 /(C 1 .C 4 ))  0.90

               1.0
                                                                    0.85
               0.5                                                  0.80


               0.0                                                  0.75
                 75%     80%    85%     90%     95%     100%           0  0.01 0.02 0.03 0.04 0.05 0.06 0.07 0.08 0.09
                            Dry gas ratio (C /(C .C ))                                   i-C 4 /C 2
                                        1
                                             4
                                           1
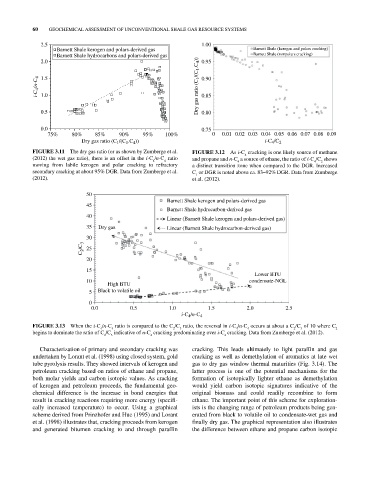
            FIGURE 3.11  The dry gas ratio (or as shown by Zumberge et al.   FIGURE 3.12  As i‐C  cracking is one likely source of methane
                                                                                  4
            (2012) the wet gas ratio), there is an offset in the i‐C /n‐C  ratio   and propane and n‐C  a source of ethane, the ratio of i‐C /C  shows
                                                       4
                                                    4
                                                                                4
                                                                                                         4
                                                                                                           2
            moving from labile kerogen and polar cracking to refractory   a distinct transition zone when compared to the DGR. Increased
            secondary cracking at about 95% DGR. Data from Zumberge et al.   C  or DGR is noted above ca. 83–92% DGR. Data from Zumberge
                                                                  1
            (2012).                                              et al. (2012).
                              50
                                                        Barnett Shale kerogen and polars-derived gas
                              45
                                                        Barnett Shale hydrocarbon-derived gas
                              40
                                                        Linear (Barnett Shale kerogen and polars-derived gas)
                              35  Dry gas               Linear (Barnett Shale hydrocarbon-derived gas)
                              30
                            C 2 /C 3  25
                              20
                              15
                                                                                     Lower BTU
                              10                                                   condensate-NGL
                                     High BTU
                              5  Black to volatile oil
                              0
                               0.0          0.5          1.0          1.5          2.0         2.5
                                                             i-C 4 /n-C 4
            FIGURE 3.13  When the i‐C /n‐C  ratio is compared to the C /C  ratio, the reversal in i‐C /n‐C  occurs at about a C /C  of 10 where C
                                                            3
                                                          2
                                                                               4
                                  4
                                                                                   4
                                                                                                  2
                                                                                                    3
                                                                                                                2
                                      4
            begins to dominate the ratio of C /C  indicative of n‐C  cracking predominating over i‐C  cracking. Data from Zumberge et al. (2012).
                                   2  3            4                       4
              Characterization of primary and secondary cracking was   cracking.  This  leads ultimately  to light  paraffin  and  gas
            undertaken by Lorant et al. (1998) using closed system, gold   cracking as well as demethylation of aromatics at late wet
            tube pyrolysis results. They showed intervals of kerogen and   gas to dry gas window thermal maturities (Fig. 3.14). The
            petroleum cracking based on ratios of ethane and propane,   latter process is one of the potential mechanisms for the
            both molar yields and carbon isotopic values. As cracking   formation of  isotopically  lighter ethane  as demethylation
            of kerogen and petroleum proceeds, the fundamental geo­  would yield carbon isotopic signatures indicative of the
            chemical difference is the increase in bond energies that   original biomass and could readily recombine to form
            result in cracking reactions requiring more energy (specifi­  ethane. The important point of this scheme for exploration­
            cally increased temperature) to occur. Using a graphical   ists is the changing range of petroleum products being gen­
            scheme derived from Prinzhofer and Huc (1995) and Lorant   erated from black to volatile oil to condensate‐wet gas and
            et al. (1998) illustrates that, cracking proceeds from kerogen   finally dry gas. The graphical representation also illustrates
            and generated bitumen cracking to and through paraffin   the difference between ethane and propane carbon isotopic
   75   76   77   78   79   80   81   82   83   84   85