
Page 75 - Fundamentals of Gas Shale Reservoirs
P. 75
ORGANOPOROSITY DEVELOPMENT 55
0 TABLE 3.2 Thermal maturity ranges or values for a low
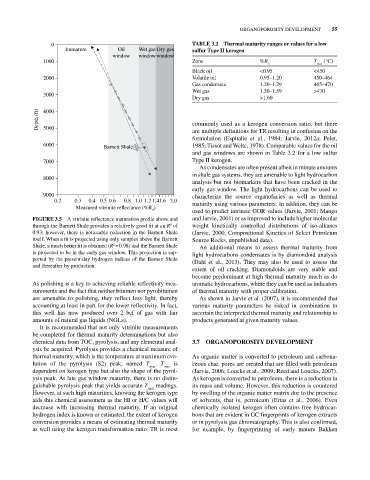
Immature Oil Wet gas Dry gas sulfur Type II kerogen
window window window
1000 Zone %R T (°C)
o max
Black oil <0.95 <450
2000 Volatile oil 0.95–1.20 450–464
Gas condensate 1.20–1.29 465–470
Wet gas 1.30–1.59 >470
3000
Dry gas >1.60
Depth (ft) 4000 commonly used as a kerogen conversion ratio, but there
5000
are multiple definitions for TR resulting in confusion on the
formulation (Espitalie et al., 1984; Jarvie, 2012a; Pelet,
6000 Barnett Shale 1985; Tissot and Welte, 1978). Comparable values for the oil
and gas windows are shown in Table 3.2 for a low sulfur
7000 Type II kerogen.
As condensates are often present albeit in minute amounts
in shale gas systems, they are amenable to light hydrocarbon
8000
analysis but not biomarkers that have been cracked in the
early gas window. The light hydrocarbons can be used to
9000 characterize the source organofacies as well as thermal
0.2 0.3 0.4 0.5 0.6 0.8 1.0 1.2 1.41.6 2.0 maturity using various parameters. In addition, they can be
)
Measured vitrinite re ectance (%R o
used to predict intrinsic GOR values (Jarvie, 2001; Mango
FIGURE 3.5 A vitrinite reflectance maturation profile above and and Jarvie, 2001) or as improved to include higher molecular
through the Barnett Shale provides a relatively good fit at an R of weight kinetically controlled distributions of iso‐alkanes
2
0.93; however, there is noticeable reduction in the Barnett Shale (Jarvie, 2000, Compositional Kinetics of Select Petroleum
itself. When a fit is projected using only samples above the Barnett Source Rocks, unpublished data).
Shale, a much better fit is obtained (R = 0.98) and the Barnett Shale An additional means to assess thermal maturity from
2
is projected to be in the early gas window. This projection is sup light hydrocarbons condensates is by diamondoid analysis
ported by the present‐day hydrogen indices of the Barnett Shale (Dahl et al., 2013). They may also be used to assess the
and thereafter by production.
extent of oil cracking. Diamondoids are very stable and
become predominant at high thermal maturity much as do
As polishing is a key to achieving reliable reflectivity mea aromatic hydrocarbons, where they can be used as indicators
surements and the fact that neither bitumen nor pyrobitumen of thermal maturity with proper calibration.
are amenable to polishing, they reflect less light, thereby As shown in Jarvie et al. (2007), it is recommended that
accounting at least in part for the lower reflectivity. In fact, various maturity parameters be risked in combination to
this well has now produced over 2 bcf of gas with fair ascertain the interpreted thermal maturity and relationship to
amounts of natural gas liquids (NGLs). products generated at given maturity values.
It is recommended that not only vitrinite measurements
be completed for thermal maturity determinations but also
chemical data from TOC, pyrolysis, and any elemental anal 3.7 ORGANOPOROSITY DEVELOPMENT
ysis be acquired. Pyrolysis provides a chemical measure of
thermal maturity, which is the temperature at maximum evo As organic matter is converted to petroleum and carbona
lution of the pyrolysis (S2) peak, named T max . T max is ceous char, pores are created that are filled with petroleum
dependent on kerogen type but also the shape of the pyrol (Jarvie, 2006; Loucks et al., 2009; Reed and Loucks, 2007).
ysis peak. At late gas window maturity, there is no distin As kerogen is converted to petroleum, there is a reduction in
guishable pyrolysis peak that yields accurate T max readings. its mass and volume. However, this reduction is countered
However, at such high maturities, knowing the kerogen type by swelling of the organic matter matrix due to the presence
aids this chemical assessment as the HI or H/C values will of solvents, that is, petroleum (Ertas et al., 2006). Even
decrease with increasing thermal maturity. If an original chemically isolated kerogen often contains free hydrocar
hydrogen index is known or estimated, the extent of kerogen bons that are evident in GC fingerprints of kerogen extracts
conversion provides a means of estimating thermal maturity or in pyrolysis gas chromatography. This is also confirmed,
as well using the kerogen transformation ratio. TR is most for example, by fingerprinting of early mature Bakken