
Page 77 - Fundamentals of Gas Shale Reservoirs
P. 77
EXPULSION–RETENTION OF PETROLEUM 57
producers, whereas the better shale oil systems are those 60
where oil has been expelled into a nearby nonsource lithofa 50 y = 14.028In(x) –30.091
2
cies, that is, a hybrid system (Jarvie, 2012b). 40 R = 0.9993
30
3.8 GAS CONTENTS 20
10
Gas contents are derived from measuring gas as it desorbs Gas content (scf/ton) 0
from canistered core with a projection of lost gas contents. –10
Gas contents are a key component in the determination –20
of sufficient volumes of gas for commercial development. –30
However, these are necessarily completed postdrill as can –40 Initial data point
istered core samples are required for accurate gas desorp –50
tion and adsorption experiments. An alternate predrill 0 50 100 150 200 250
approach has been utilized in various North American shale Square root of time (min)
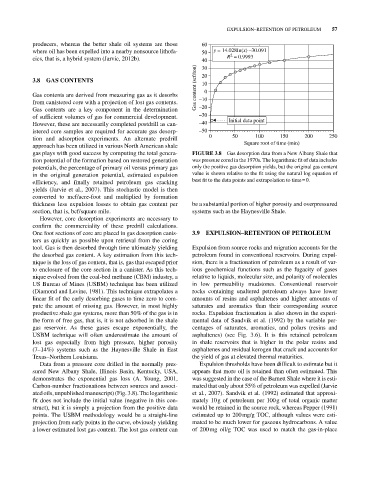
gas plays with good success by computing the total genera FIGURE 3.8 Gas desorption data from a New Albany Shale that
tion potential of the formation based on restored generation was pressure cored in the 1970s. The logarithmic fit of data includes
potentials, the percentage of primary oil versus primary gas only the positive gas desorption yields, but the original gas content
in the original generation potential, estimated expulsion value is shown relative to the fit using the natural log equation of
efficiency, and finally retained petroleum gas cracking best fit to the data points and extrapolation to time = 0.
yields (Jarvie et al., 2007). This stochastic model is then
converted to mcf/acre‐foot and multiplied by formation
thickness less expulsion losses to obtain gas content per be a substantial portion of higher porosity and overpressured
section, that is, bcf/square mile. systems such as the Haynesville Shale.
However, core desorption experiments are necessary to
confirm the commerciality of these predrill calculations.
One foot sections of core are placed in gas desorption canis 3.9 EXPULSION–RETENTION OF PETROLEUM
ters as quickly as possible upon retrieval from the coring
tool. Gas is then desorbed through time ultimately yielding Expulsion from source rocks and migration accounts for the
the desorbed gas content. A key estimation from this tech petroleum found in conventional reservoirs. During expul
nique is the loss of gas content, that is, gas that escaped prior sion, there is a fractionation of petroleum as a result of var
to enclosure of the core section in a canister. As this tech ious geochemical functions such as the fugacity of gases
nique evolved from the coal‐bed methane (CBM) industry, a relative to liquids, molecular size, and polarity of molecules
US Bureau of Mines (USBM) technique has been utilized in low permeability mudstones. Conventional reservoir
(Diamond and Levine, 1981). This technique extrapolates a rocks containing unaltered petroleum always have lower
linear fit of the early desorbing gases to time zero to com amounts of resins and asphaltenes and higher amounts of
pute the amount of missing gas. However, in most highly saturates and aromatics than their corresponding source
productive shale gas systems, more than 50% of the gas is in rocks. Expulsion fractionation is also shown in the experi
the form of free gas, that is, it is not adsorbed in the shale mental data of Sandvik et al. (1992) by the variable per
gas reservoir. As these gases escape exponentially, the centages of saturates, aromatics, and polars (resins and
USBM technique will often underestimate the amount of asphaltenes) (see Fig. 3.6). It is this retained petroleum
lost gas especially from high pressure, higher porosity in shale reservoirs that is higher in the polar resins and
(7–14%) systems such as the Haynesville Shale in East asphaltenes and residual kerogen that crack and accounts for
Texas–Northern Louisiana. the yield of gas at elevated thermal maturities.
Data from a pressure core drilled in the normally pres Expulsion thresholds have been difficult to estimate but it
sured New Albany Shale, Illinois Basin, Kentucky, USA, appears that more oil is retained than often estimated. This
demonstrates the exponential gas loss (A. Young, 2001, was suggested in the case of the Barnett Shale where it is esti
Carbon‐number fractionations between sources and associ mated that only about 55% of petroleum was expelled (Jarvie
ated oils, unpublished manuscript) (Fig. 3.8). The logarithmic et al., 2007). Sandvik et al. (1992) estimated that approxi
fit does not include the initial value (negative in this con mately 10 g of petroleum per 100 g of total organic matter
struct), but it is simply a projection from the positive data would be retained in the source rock, whereas Pepper (1991)
points. The USBM methodology would be a straight‐line estimated up to 200 mg/g TOC, although values were esti
projection from early points in the curve, obviously yielding mated to be much lower for gaseous hydrocarbons. A value
a lower estimated lost gas content. The lost gas content can of 200 mg oil/g TOC was used to match the gas‐in‐place