Page 82 - Fundamentals of Gas Shale Reservoirs
P. 82

62   GEOCHEMICAL ASSESSMENT OF UNCONVENTIONAL SHALE GAS RESOURCE SYSTEMS

                                –80.0
                                                                             Barnett Shale (C  vs C ) 2
                                                                                      1
                                –75.0                                        Fayetteville Shale (C  vs C )
                                                                                         1
                                                                                            2
                                                                                      3
                                –70.0  Biogenic gas           90%       80%  Barnett Shale (C  vs C ) 2  2
                                                                             Fayetteville Shale (C  vs C )
                                                                                         3
                                 13 C methane, propane (per million)  –55.0  Rollover  50%
                                –65.0
                                                                               70%
                                –60.0
                                                                                   60%
                                                                                      40%
                                –50.0
                                                                                      30%
                                –45.0
                                                                                      20%
                                –40.0
                                                                                      10%
                                –35.0
                                                                                           13
                                                                                       13
                                                                                         1
                                –30.0
                                –25.0                                                   C  vs   C 2
                                                                                       13
                                                                                           13
                                –20.0                     0.80%      1.50%  2.30%       C  vs   C 2
                                                                                         3
                                                    Roe=0.70%  1.10%     1.80%     3.20%
                                –15.0
                                   –50.0   –45.0   –40.0   –35.0    –30.0   –25.0   –20.0   –15.0
                                                         13
                                                          C ethane (per million)
                                                                                       13
                                                                         13
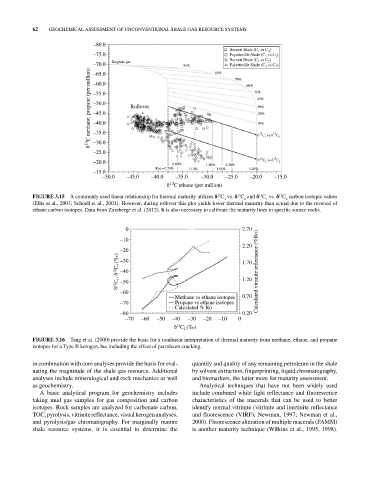
            FIGURE 3.15  A commonly used linear relationship for thermal maturity utilizes δ C  vs. δ C  and δ C  vs. δ C  carbon isotopic values
                                                                                13
                                                                                             13
                                                                                         1
                                                                           3
                                                                                  2
                                                                                                2
            (Ellis et al., 2003; Schoell et al., 2001). However, during rollover this plot yields lower thermal maturity than actual due to the reversal of
            ethane carbon isotopes. Data from Zumberge et al. (2012). It is also necessary to calibrate the maturity lines to specific source rocks.
                                           0                                     2.70
                                         –10
                                                                                 2.20
                                         –20
                                          13 C 1 ,   13 C 3  (‰)  –40            1.70 Calculated vitrinite re	ectance (%Ro)
                                         –30
                                                                                 1.20
                                         –50
                                         –60
                                                           Methane vs ethane isotopes  0.70
                                         –70               Propane vs ethane isotopes
                                                           Calculated % Ro
                                         –80                                     0.20
                                           –70  –60  –50  –40  –30  –20  –10    0
                                                             C (‰)
                                                           13
                                                              2
            FIGURE 3.16  Tang et al. (2000) provide the basis for a nonlinear interpretation of thermal maturity from methane, ethane, and propane
            isotopes for a Type II kerogen, but including the effect of petroleum cracking.
            in combination with core analyses provide the basis for eval­  quantity and quality of any remaining petroleum in the shale
            uating the magnitude of the shale gas resource. Additional   by solvent extraction, fingerprinting, liquid chromatography,
            analyses include mineralogical and rock mechanics as well   and biomarkers, the latter more for maturity assessment.
            as geochemistry.                                       Analytical techniques that have not been widely used
              A basic analytical program for geochemistry includes   include combined white light reflectance and fluorescence
            taking mud gas samples for gas composition and carbon   characteristics of the macerals that can be used to better
            isotopes. Rock samples are analyzed for carbonate carbon,   identify normal vitrinite (vitrinite and inertinite reflectance
            TOC, pyrolysis, vitrinite reflectance, visual kerogen analyses,   and fluorescence (VIRF); Newman, 1997; Newman et al.,
            and pyrolysis/gas chromatography. For marginally mature   2000). Fluorescence alteration of multiple macerals (FAMM)
            shale resource systems, it is essential to determine the   is another maturity technique (Wilkins et al., 1995, 1998).
   77   78   79   80   81   82   83   84   85   86   87