
Page 85 - Fundamentals of Gas Shale Reservoirs
P. 85
CONCLUSIONS 65
TABLE 3.5 Average (P50) production yields of selected shale gas resource systems in North America based on relative production
decline curves a
System First month decline (%) First year decline (%) Exponent (m) IP first 30 days (mcf) Cumulative 30 years (bcf)
Marcellus 15 64 1.40 5400 5.955
Haynesville 27 77 1.40 8300 5.787
Muskwa 23 71 1.60 4789 4.789
Montney 10 54 1.25 3300 4.439
Barnett 15 64 1.40 1500 1.696
Fayetteville 15 65 1.30 1300 1.296
a See input listed in Table 3.4 and Fig. 3.17.
10
Projected 30-year production
9
Projected 40-year production
8 7 Projected 50-year production 6.41 6.92 6.64 7.21
Billion cubic feet of gas 6 5 4 5.79 5.95 4.79 5.41 5.94 4.44 4.91 5.30
2 3 1.70 1.89 2.05 1.30 1.43 1.54
1
0
Barnett Fayetteville Haynesville Marcellus Muskwa Montney
Shale Shale Shale Shale Shale Shale
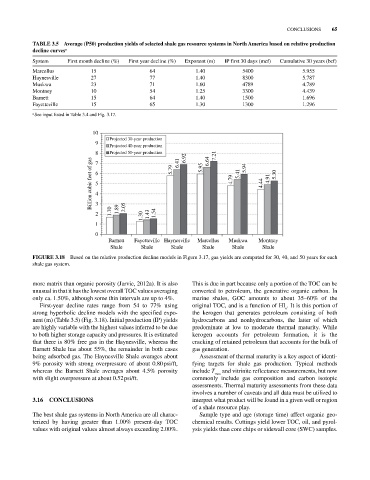
FIGURE 3.18 Based on the relative production decline models in Figure 3.17, gas yields are computed for 30, 40, and 50 years for each
shale gas system.
more matrix than organic porosity (Jarvie, 2012a). It is also This is due in part because only a portion of the TOC can be
unusual in that it has the lowest overall TOC values averaging converted to petroleum, the generative organic carbon. In
only ca. 1.50%, although some thin intervals are up to 4%. marine shales, GOC amounts to about 35–60% of the
First‐year decline rates range from 54 to 77% using original TOC, and is a function of HI . It is this portion of
o
strong hyperbolic decline models with the specified expo the kerogen that generates petroleum consisting of both
nent (m) (Table 3.5) (Fig. 3.18). Initial production (IP) yields hydrocarbons and nonhydrocarbons, the latter of which
are highly variable with the highest values inferred to be due predominate at low to moderate thermal maturity. While
to both higher storage capacity and pressures. It is estimated kerogen accounts for petroleum formation, it is the
that there is 80% free gas in the Haynesville, whereas the cracking of retained petroleum that accounts for the bulk of
Barnett Shale has about 55%, the remainder in both cases gas generation.
being adsorbed gas. The Haynesville Shale averages about Assessment of thermal maturity is a key aspect of identi
9% porosity with strong overpressure of about 0.80 psi/ft, fying targets for shale gas production. Typical methods
whereas the Barnett Shale averages about 4.5% porosity include T max and vitrinite reflectance measurements, but now
with slight overpressure at about 0.52 psi/ft. commonly include gas composition and carbon isotopic
assessments. Thermal maturity assessments from these data
involves a number of caveats and all data must be utilized to
3.16 CONCLUSIONS interpret what product will be found in a given well or region
of a shale resource play.
The best shale gas systems in North America are all charac Sample type and age (storage time) affect organic geo
terized by having greater than 1.00% present‐day TOC chemical results. Cuttings yield lower TOC, oil, and pyrol
values with original values almost always exceeding 2.00%. ysis yields than core chips or sidewall core (SWC) samples.